
Peek & Filter
The topic list
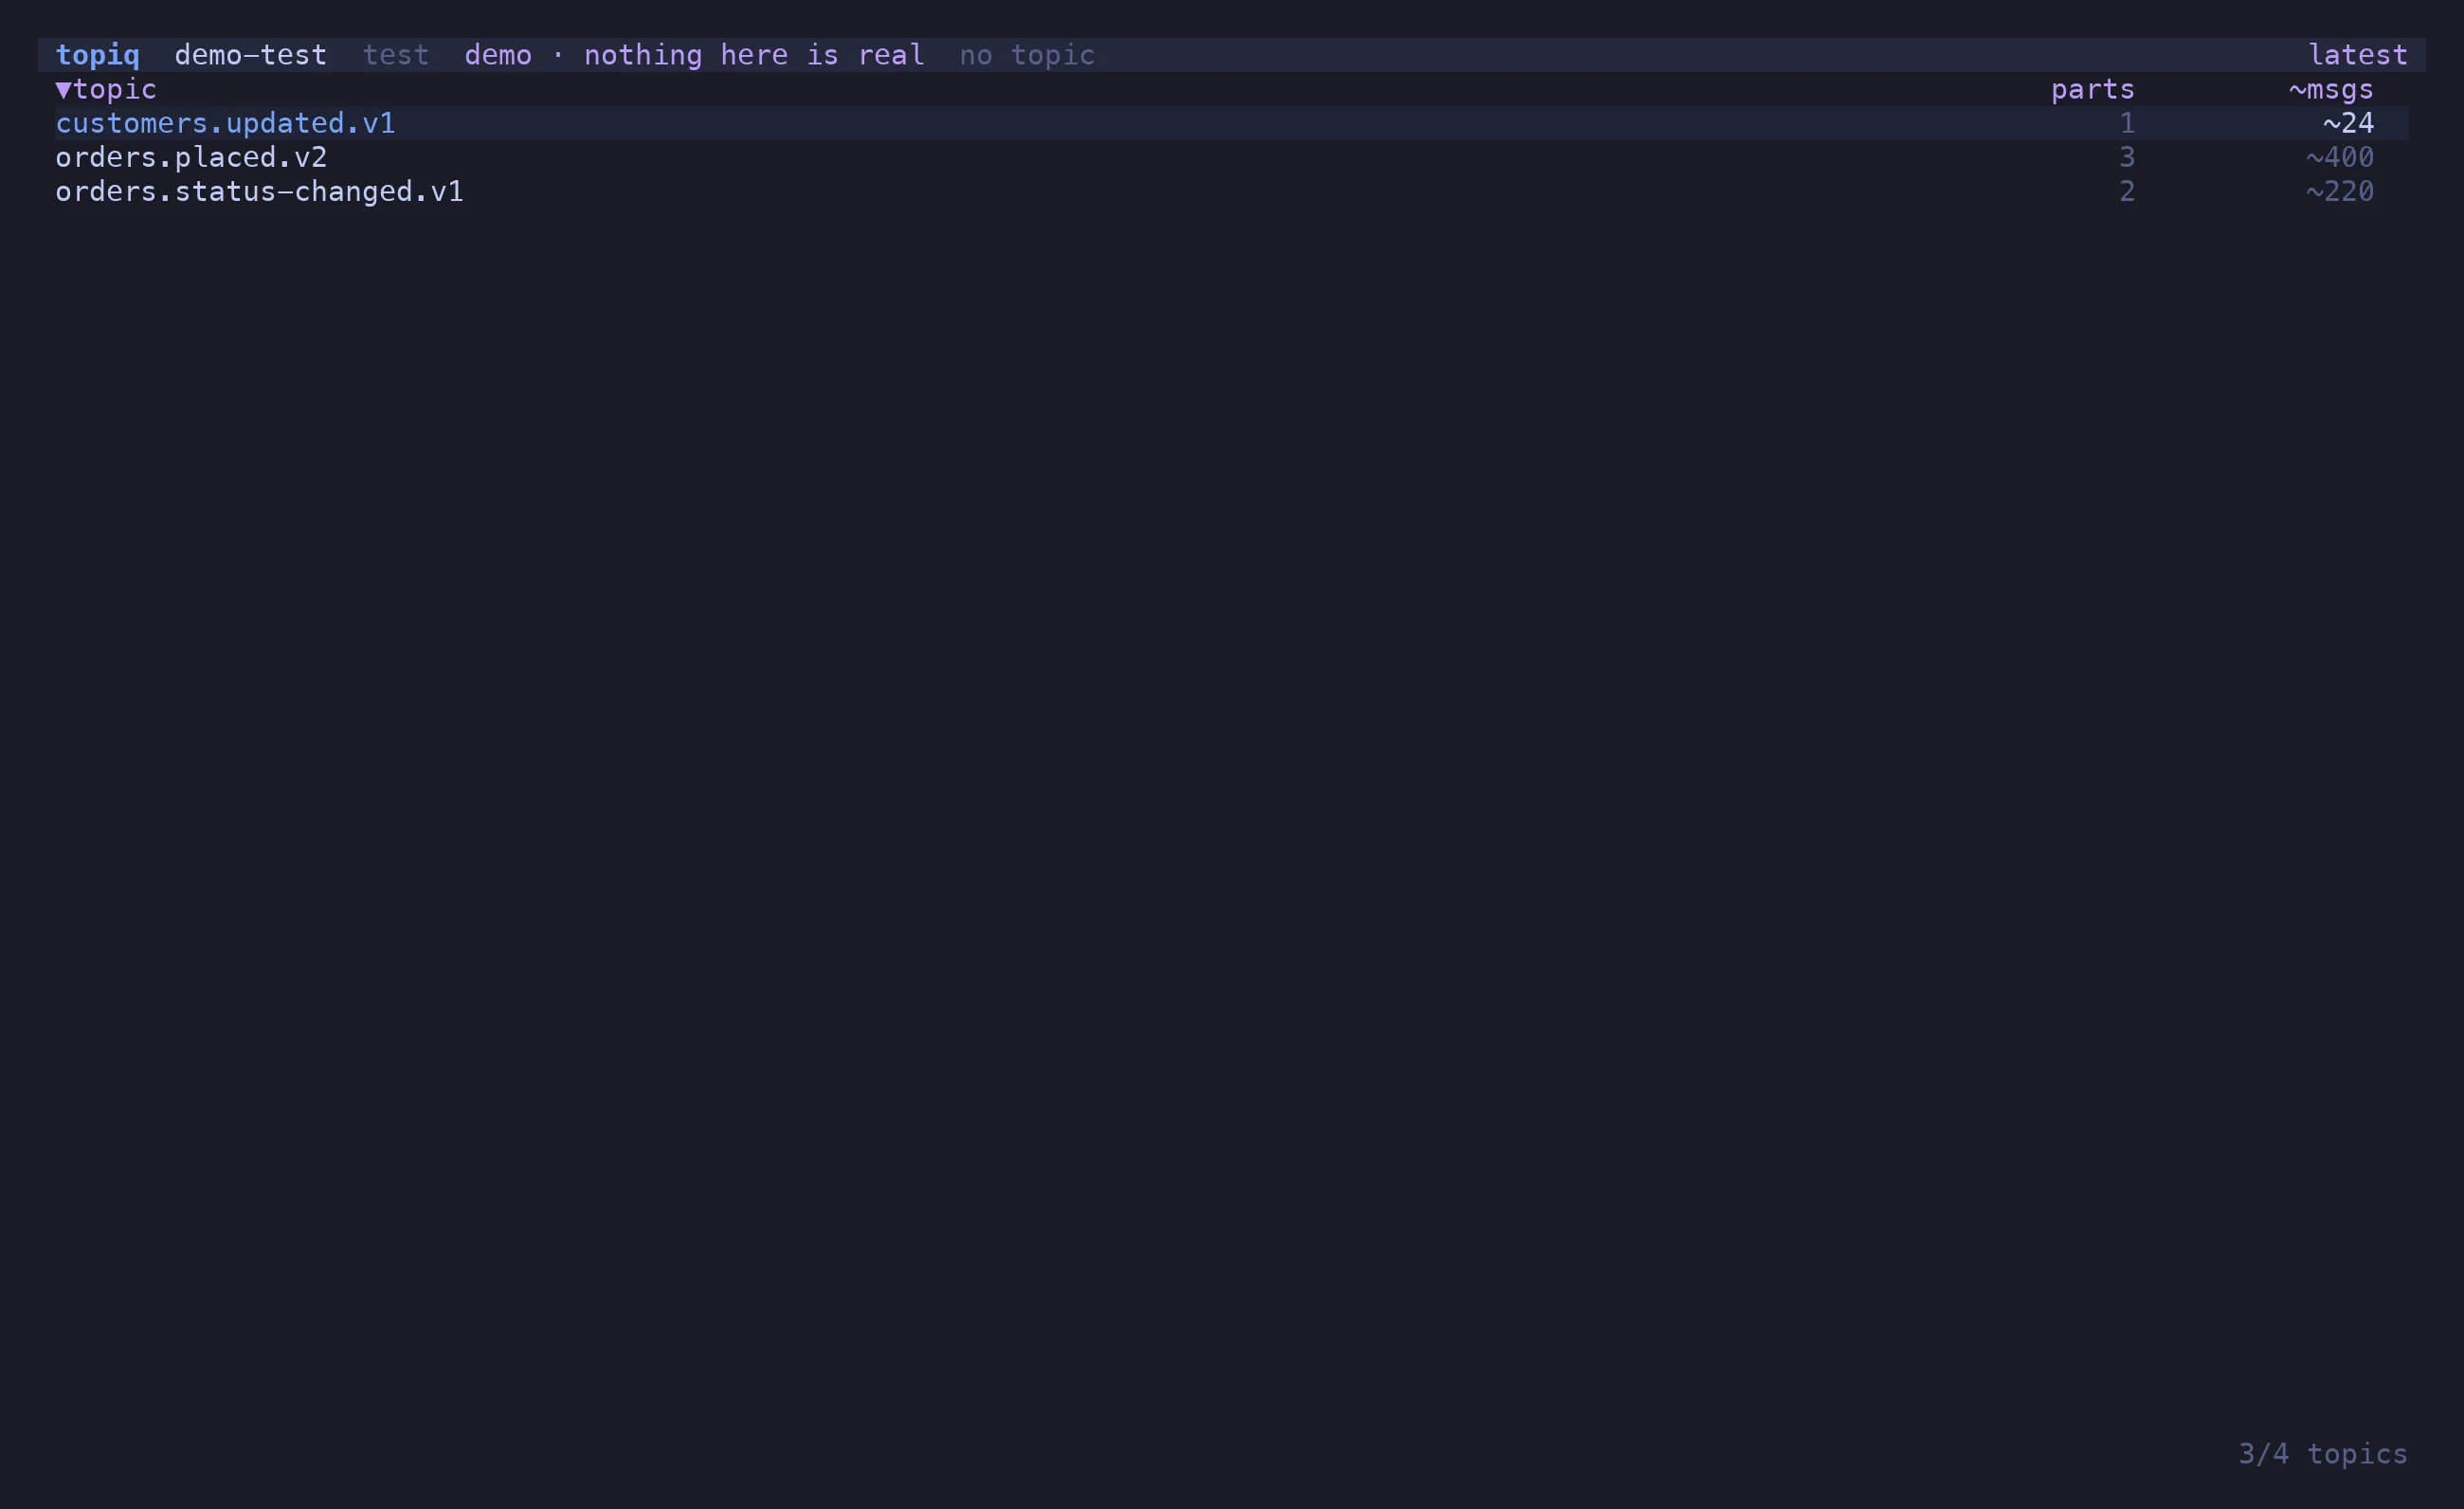
Section titled “The topic list”Connect and every topic is listed with its partition count. Watermarks — and the approximate message count they imply — are measured only for the rows on screen, because a cluster with two thousand topics cannot afford one request per topic up front. The listing is cached per cluster so the first paint is instant; the cache is revalidated behind it.
/ filters by name, i shows the _-prefixed internal topics, s cycles the sort, p
opens the partition pane (low, high, count per partition), c opens the consumer groups.
The message table
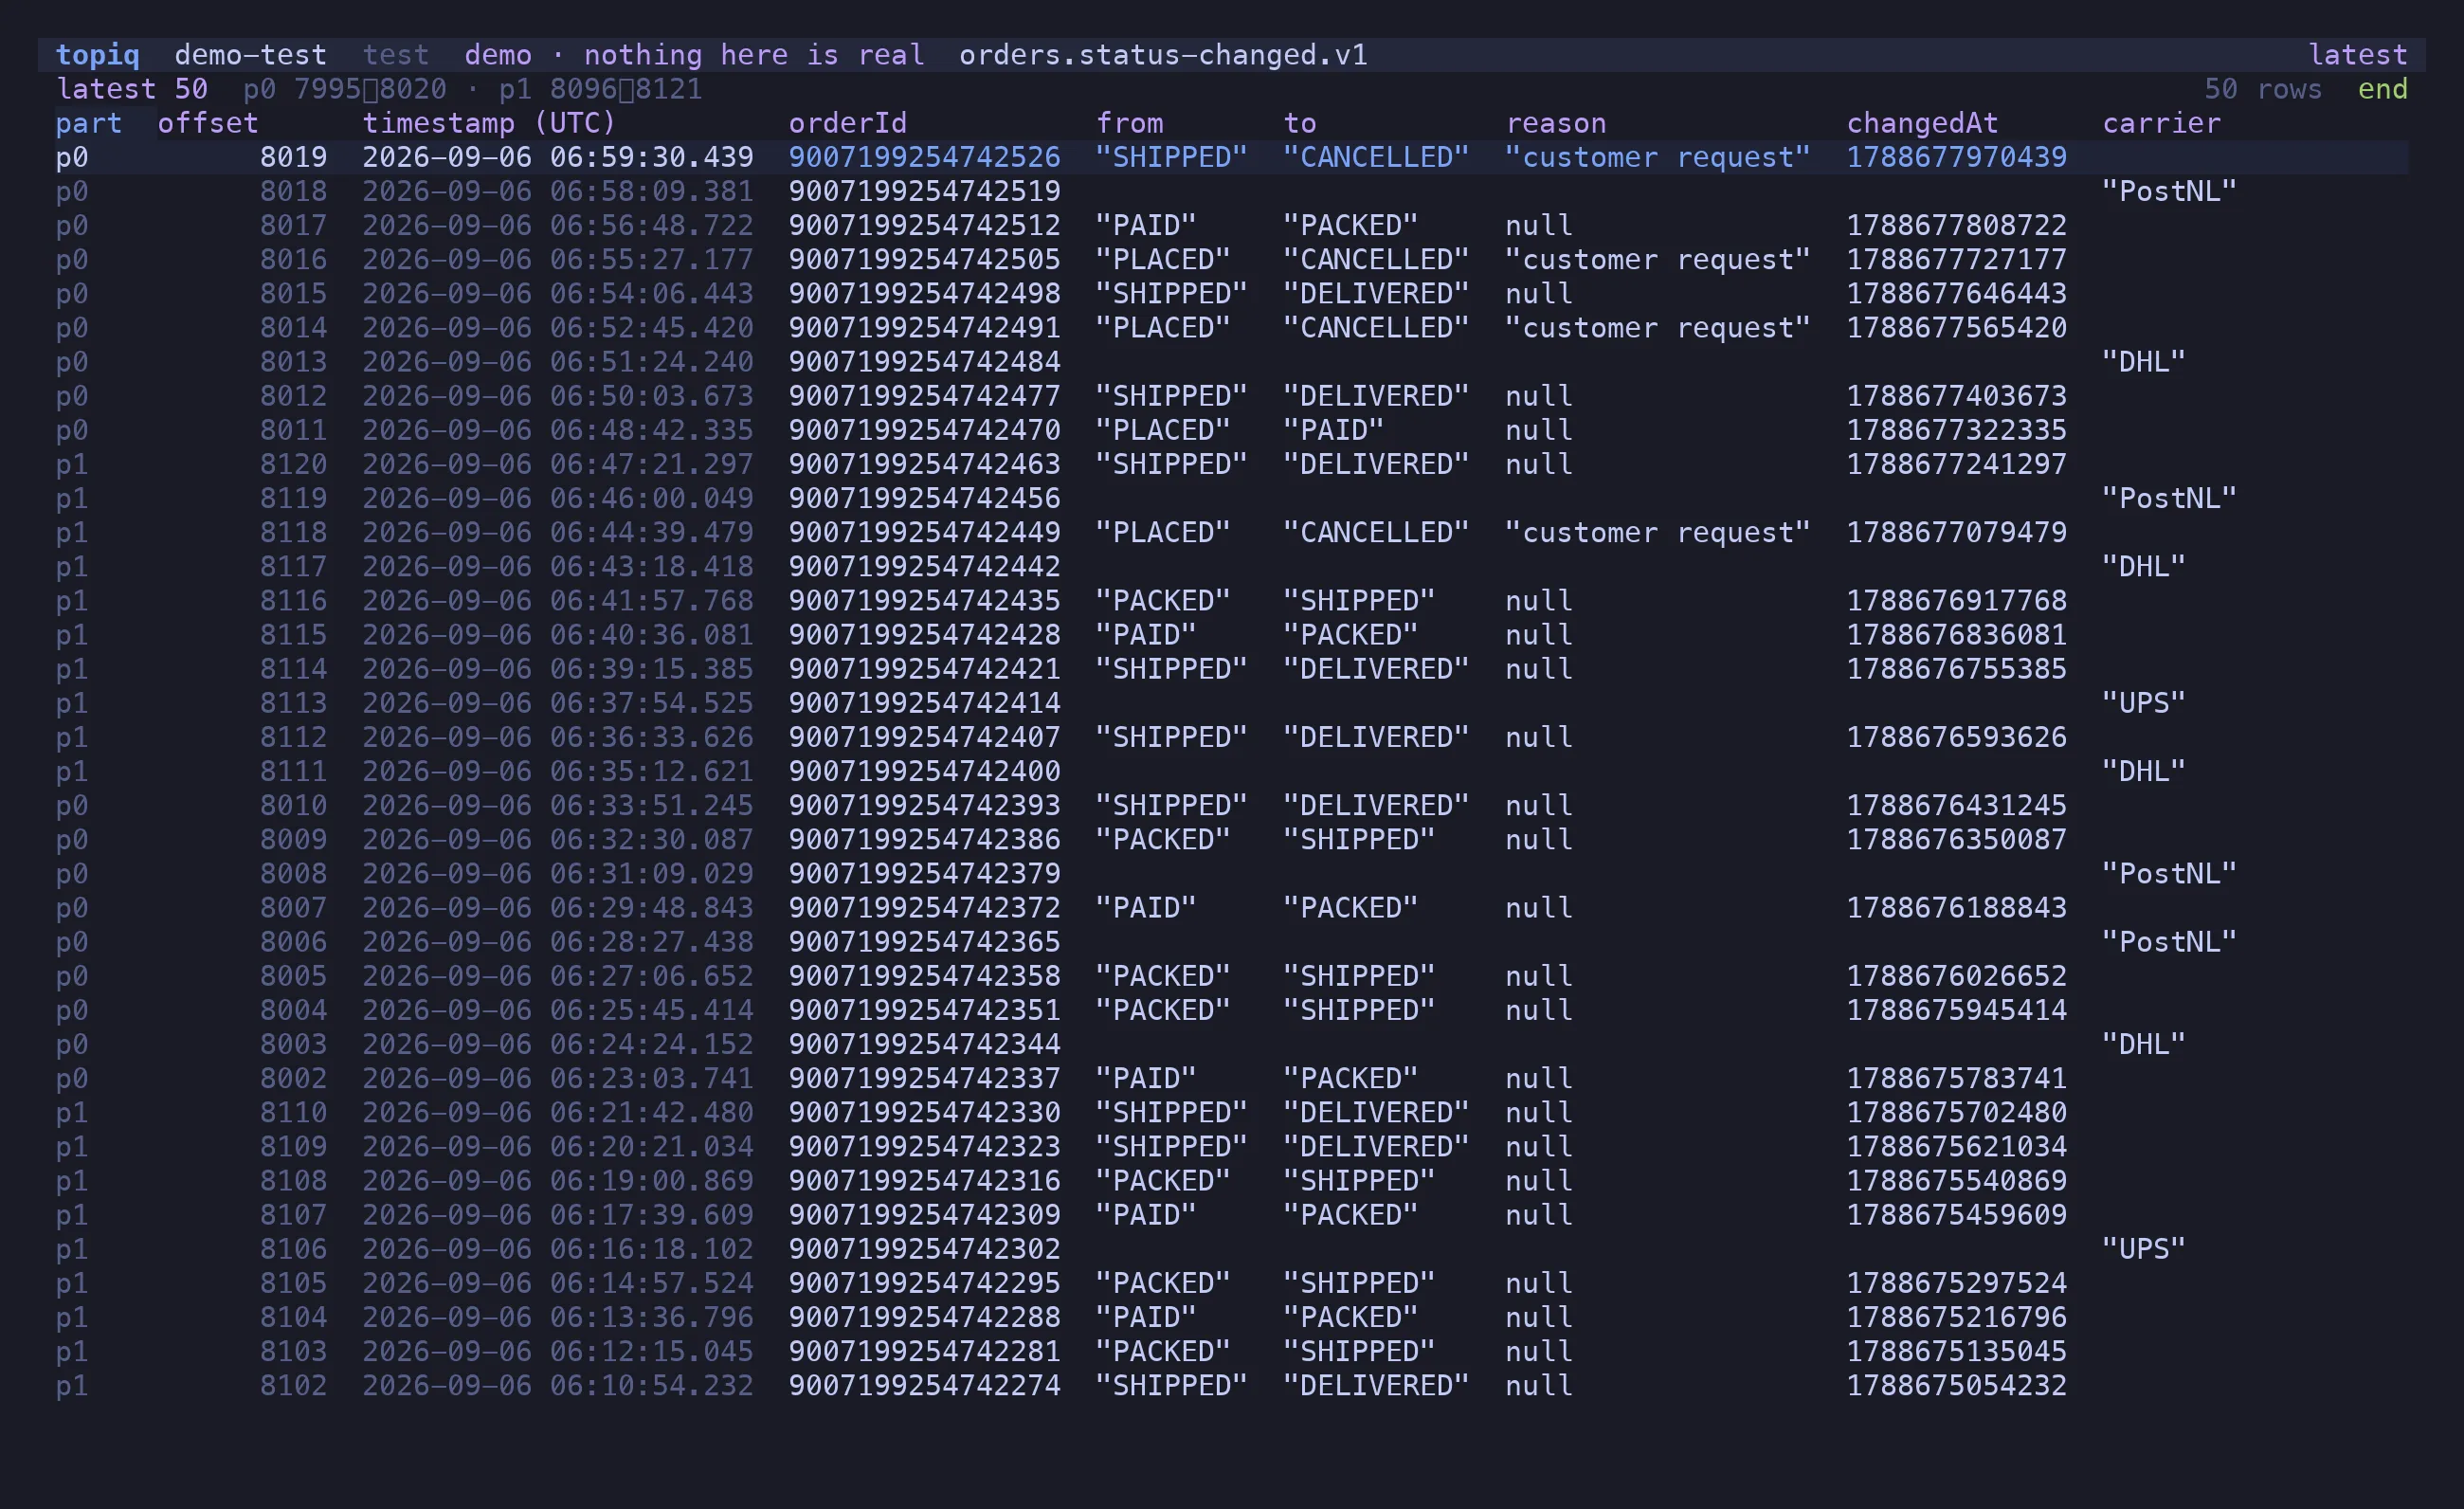
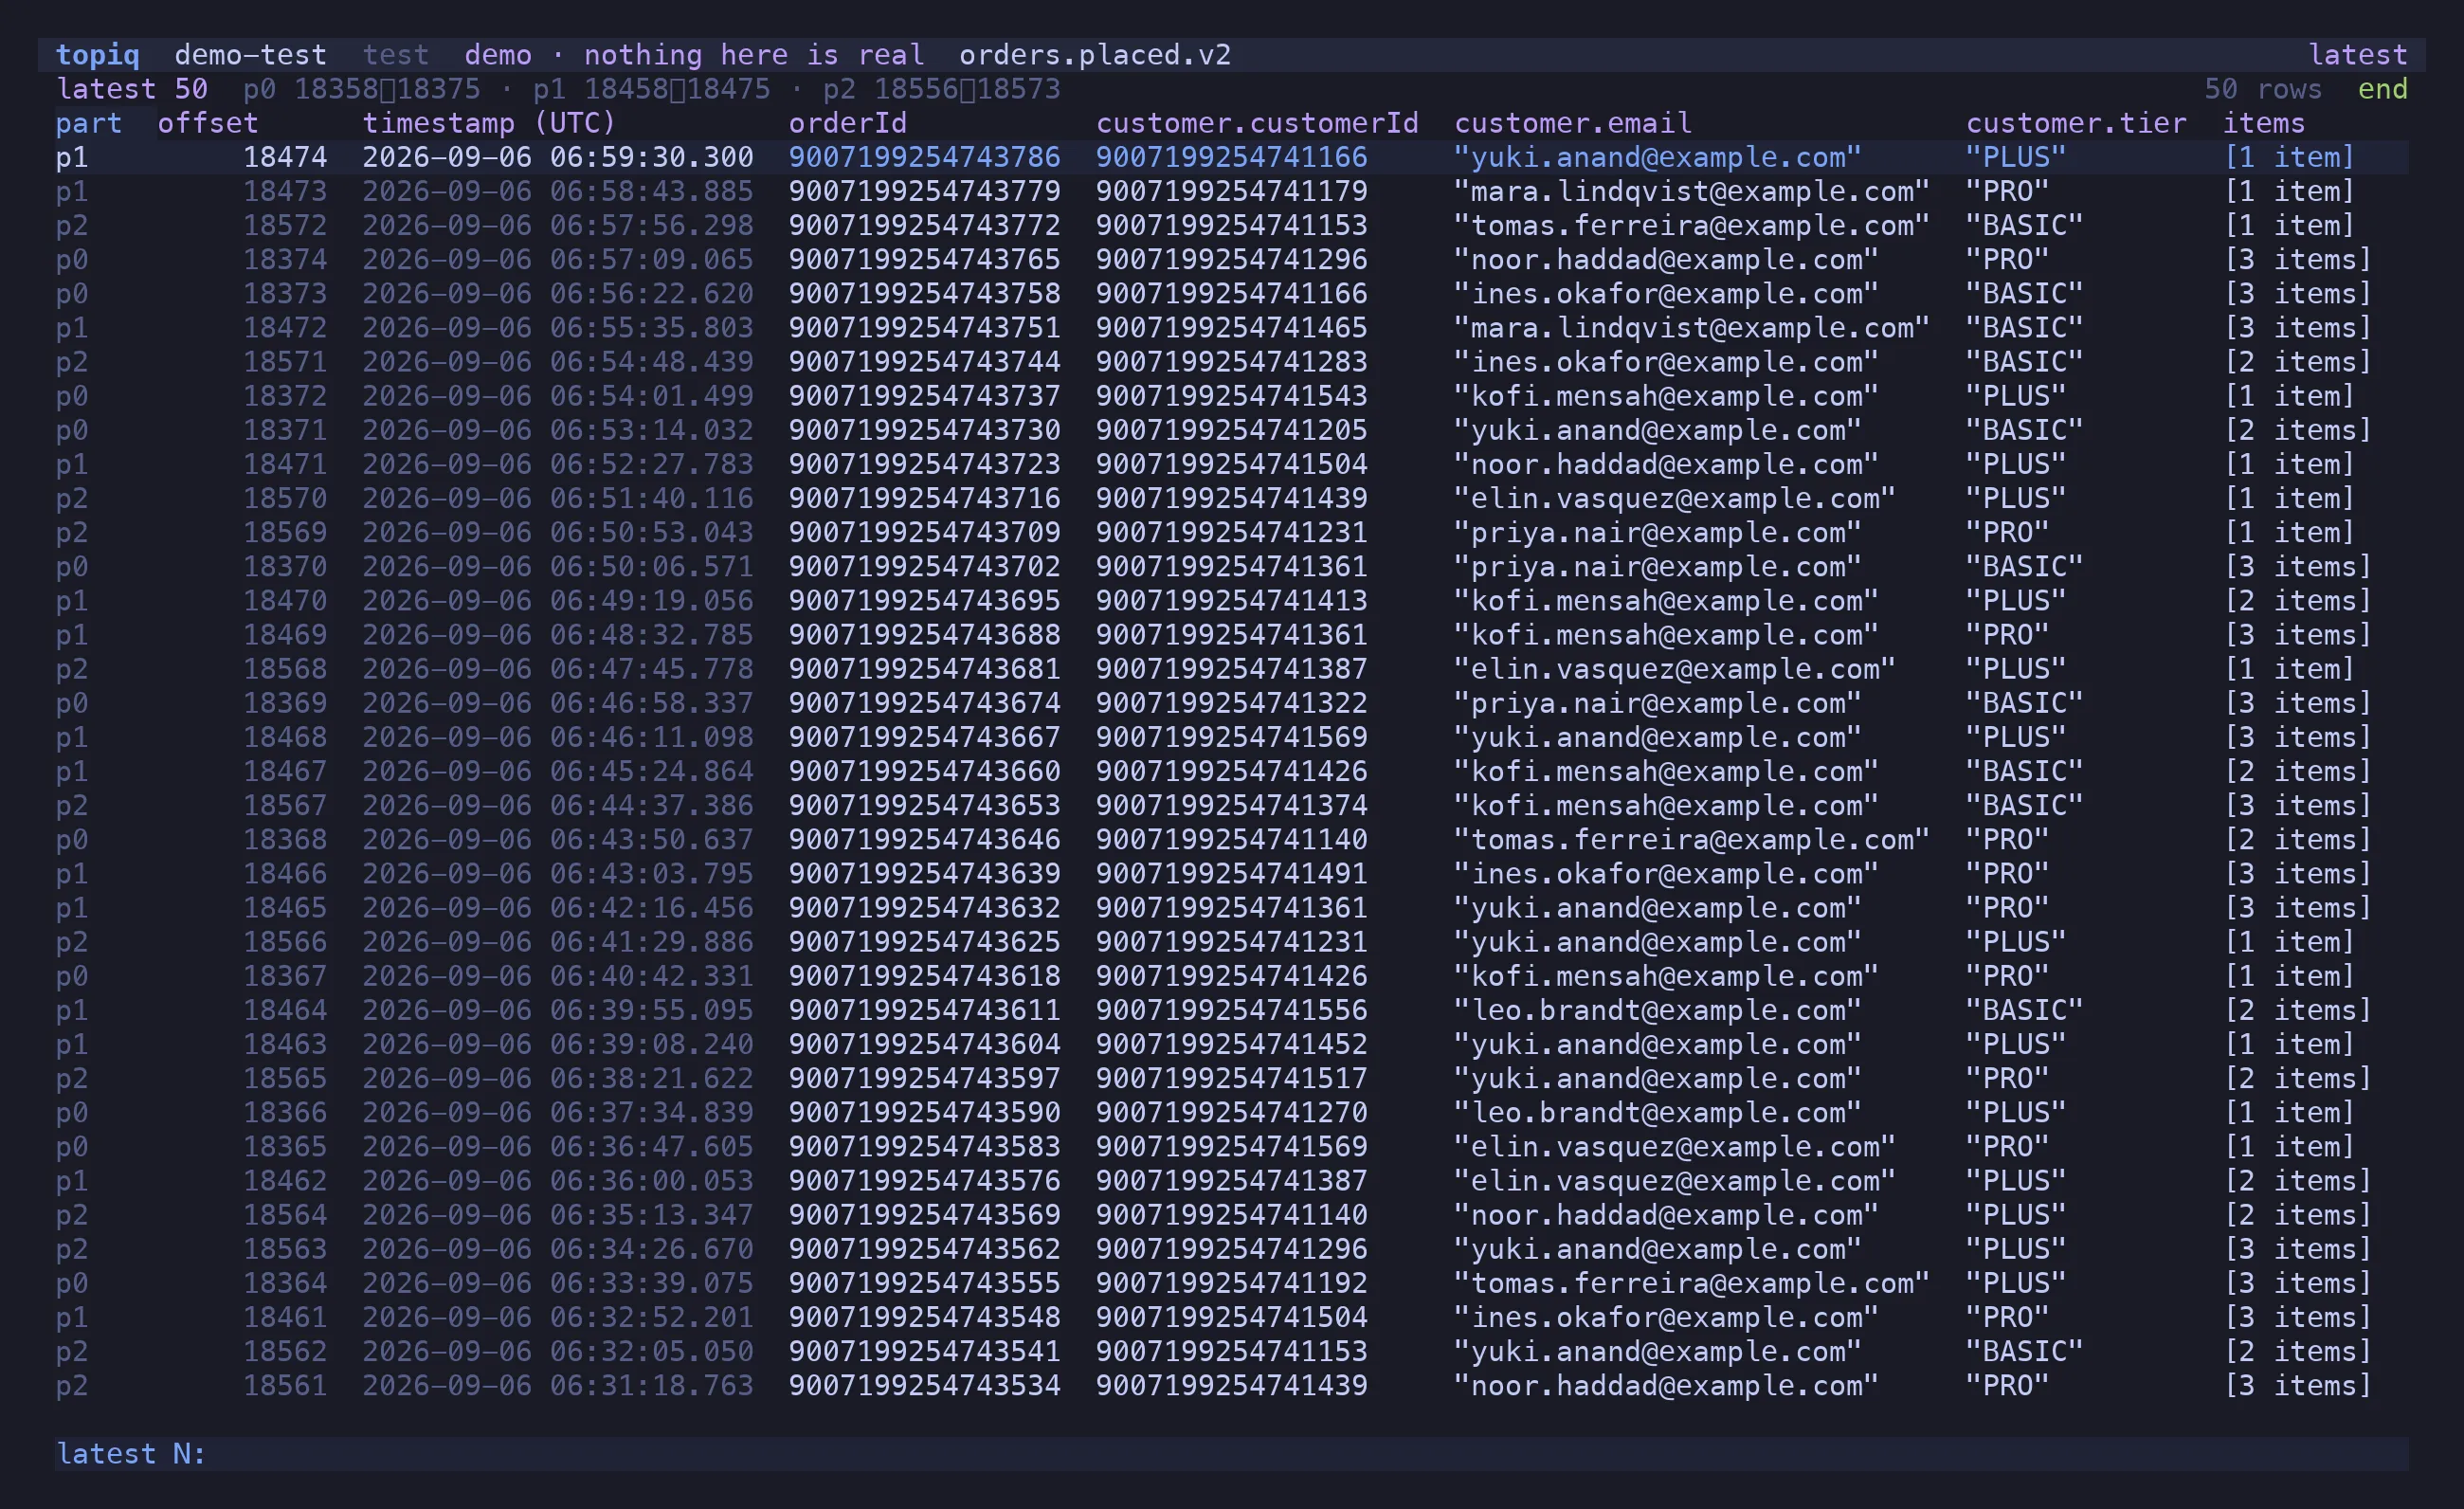
Section titled “The message table”Enter opens the latest 50, newest first. Partitions have no global order, so rows sort
by timestamp with partition and offset as tiebreak; row 0 is the newest row everywhere, which
is also where the tail pins.
Columns are inferred from the decoded values — sampled across the whole window, so one odd
message does not dictate the layout. Nested records flatten to dotted paths
(customer.tier), arrays summarise ([3 items]), and a topic carrying two event types shows
the union of their fields with blanks where a row has none.
Every Avro long is a BigInt, rendered as bare digits. Number never touches an int64
anywhere in topiq — not on decode, not on sort, not on filter, not on re-encode.
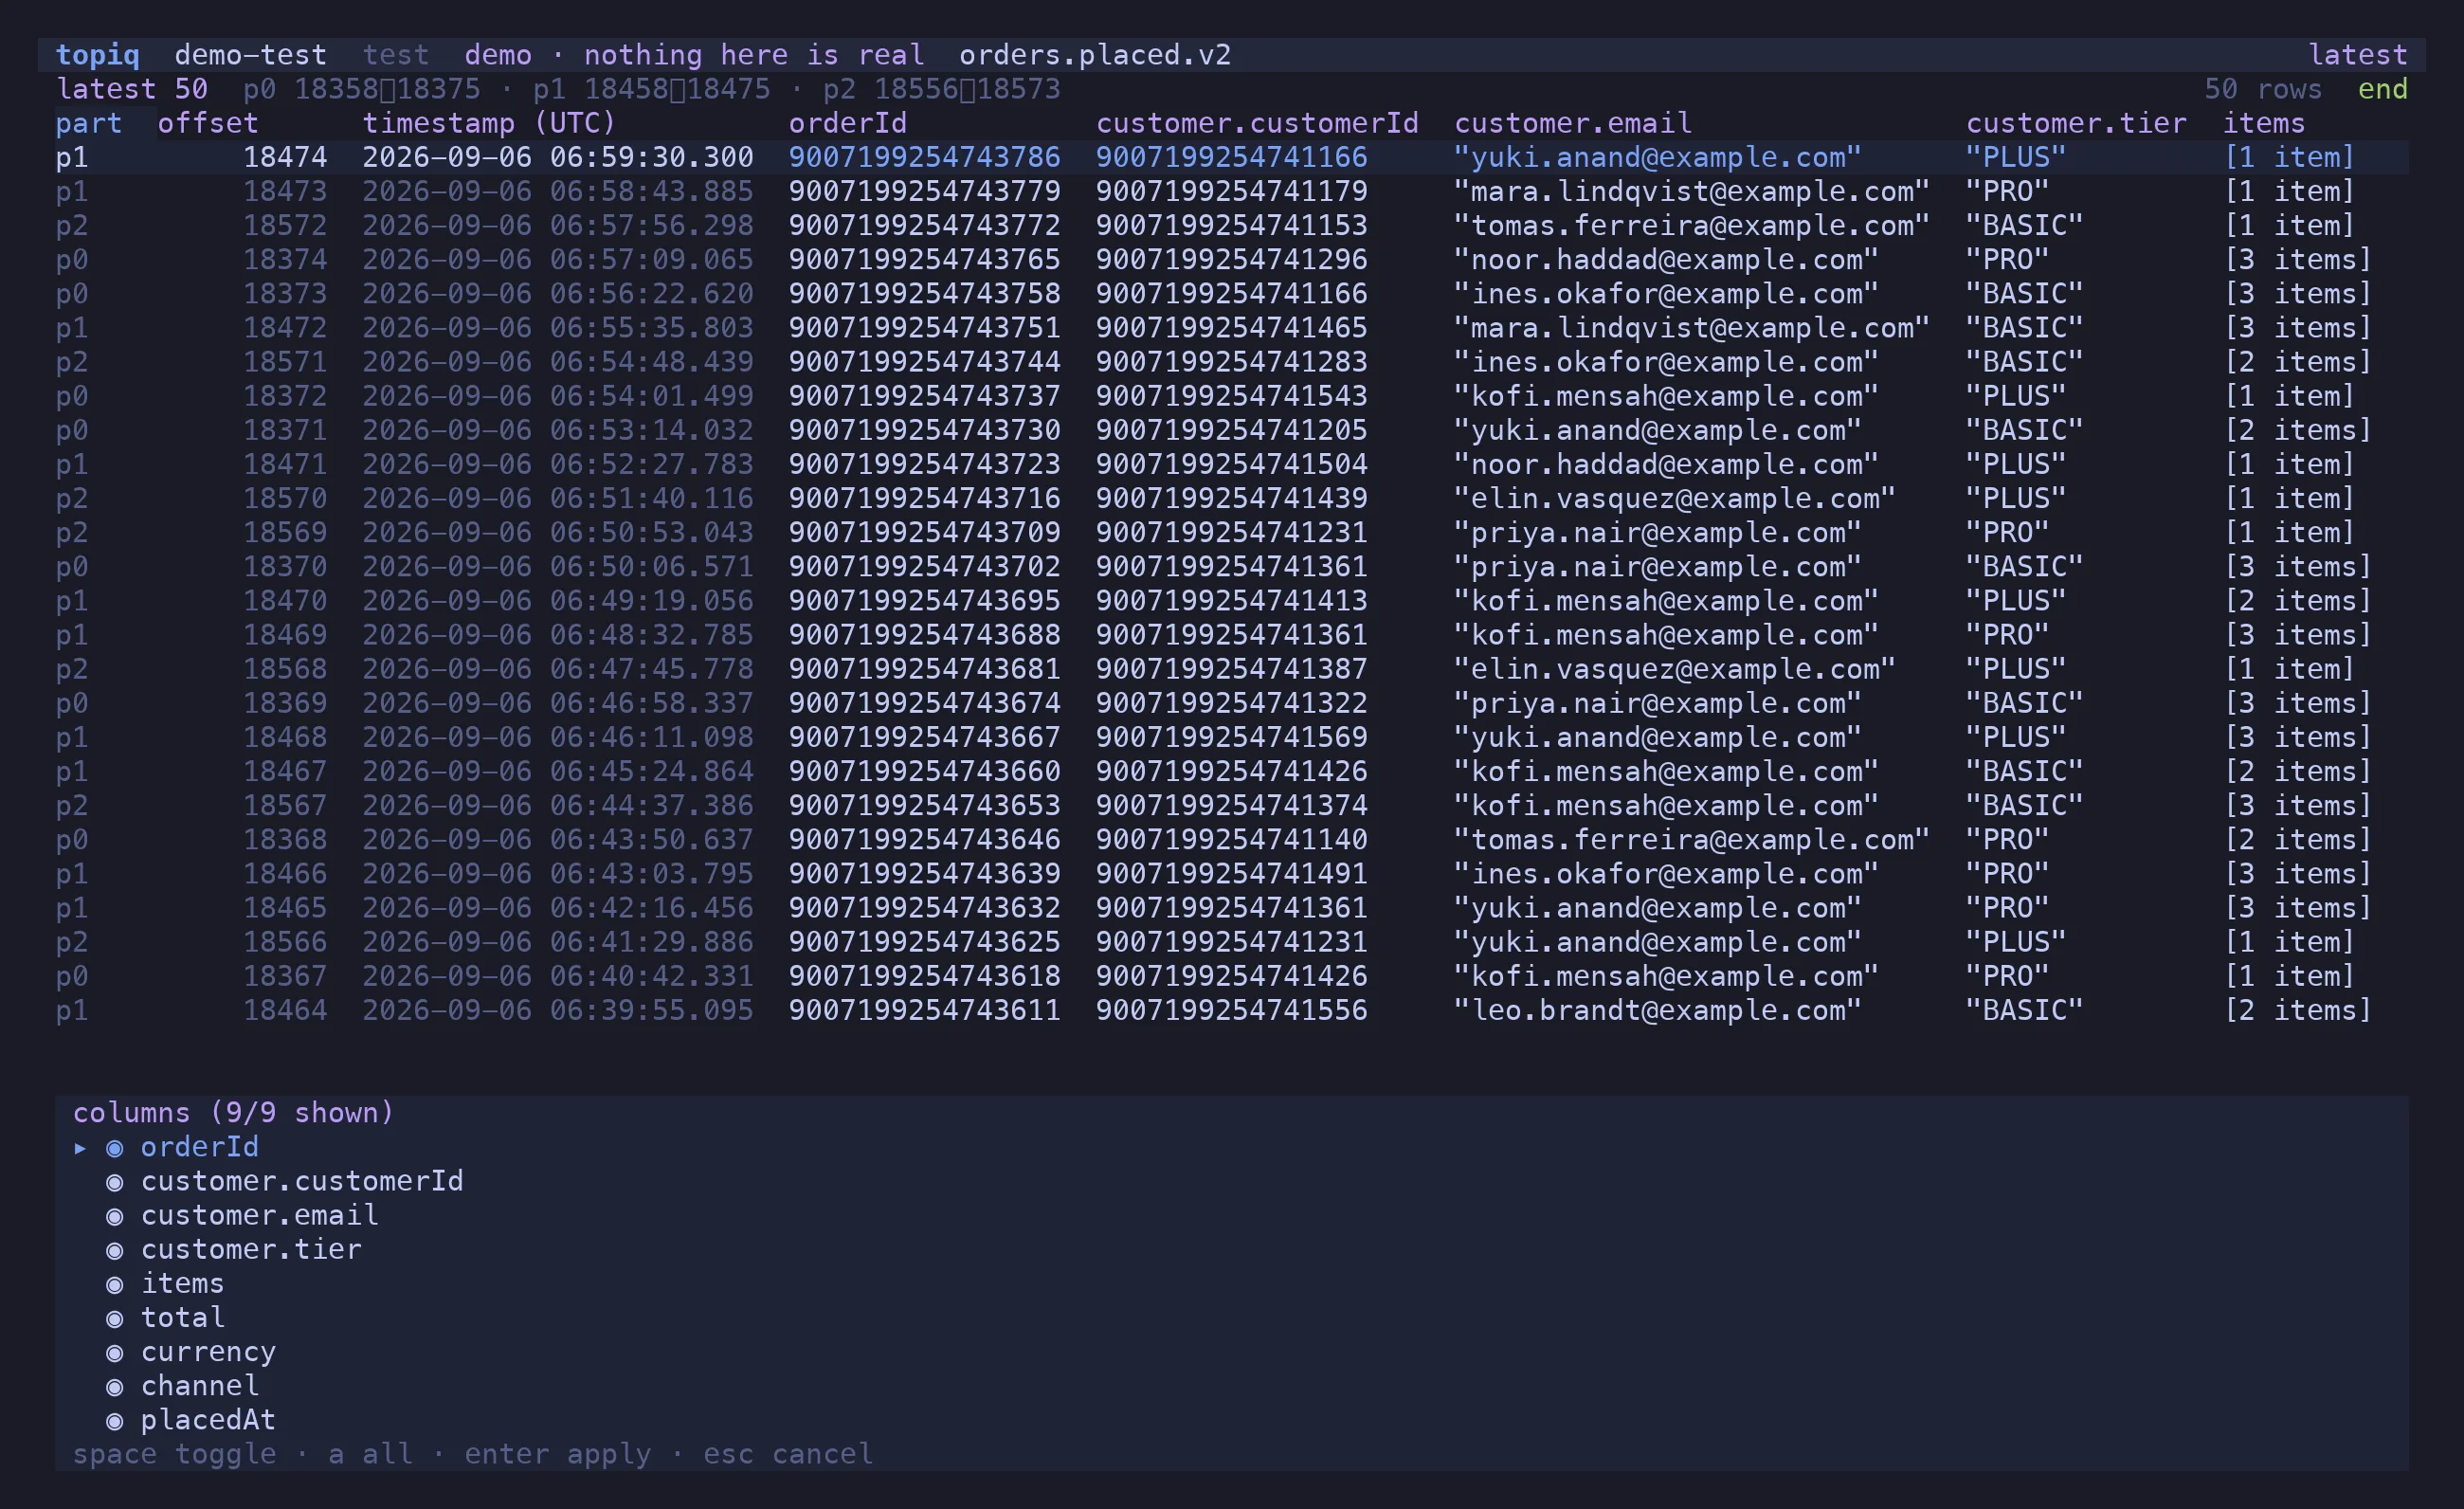
h/l walk the columns, s sorts by the selected one (BigInt compares as BigInt, absent
values sort last in both directions), - hides it, c opens the picker, 0/$ jump.
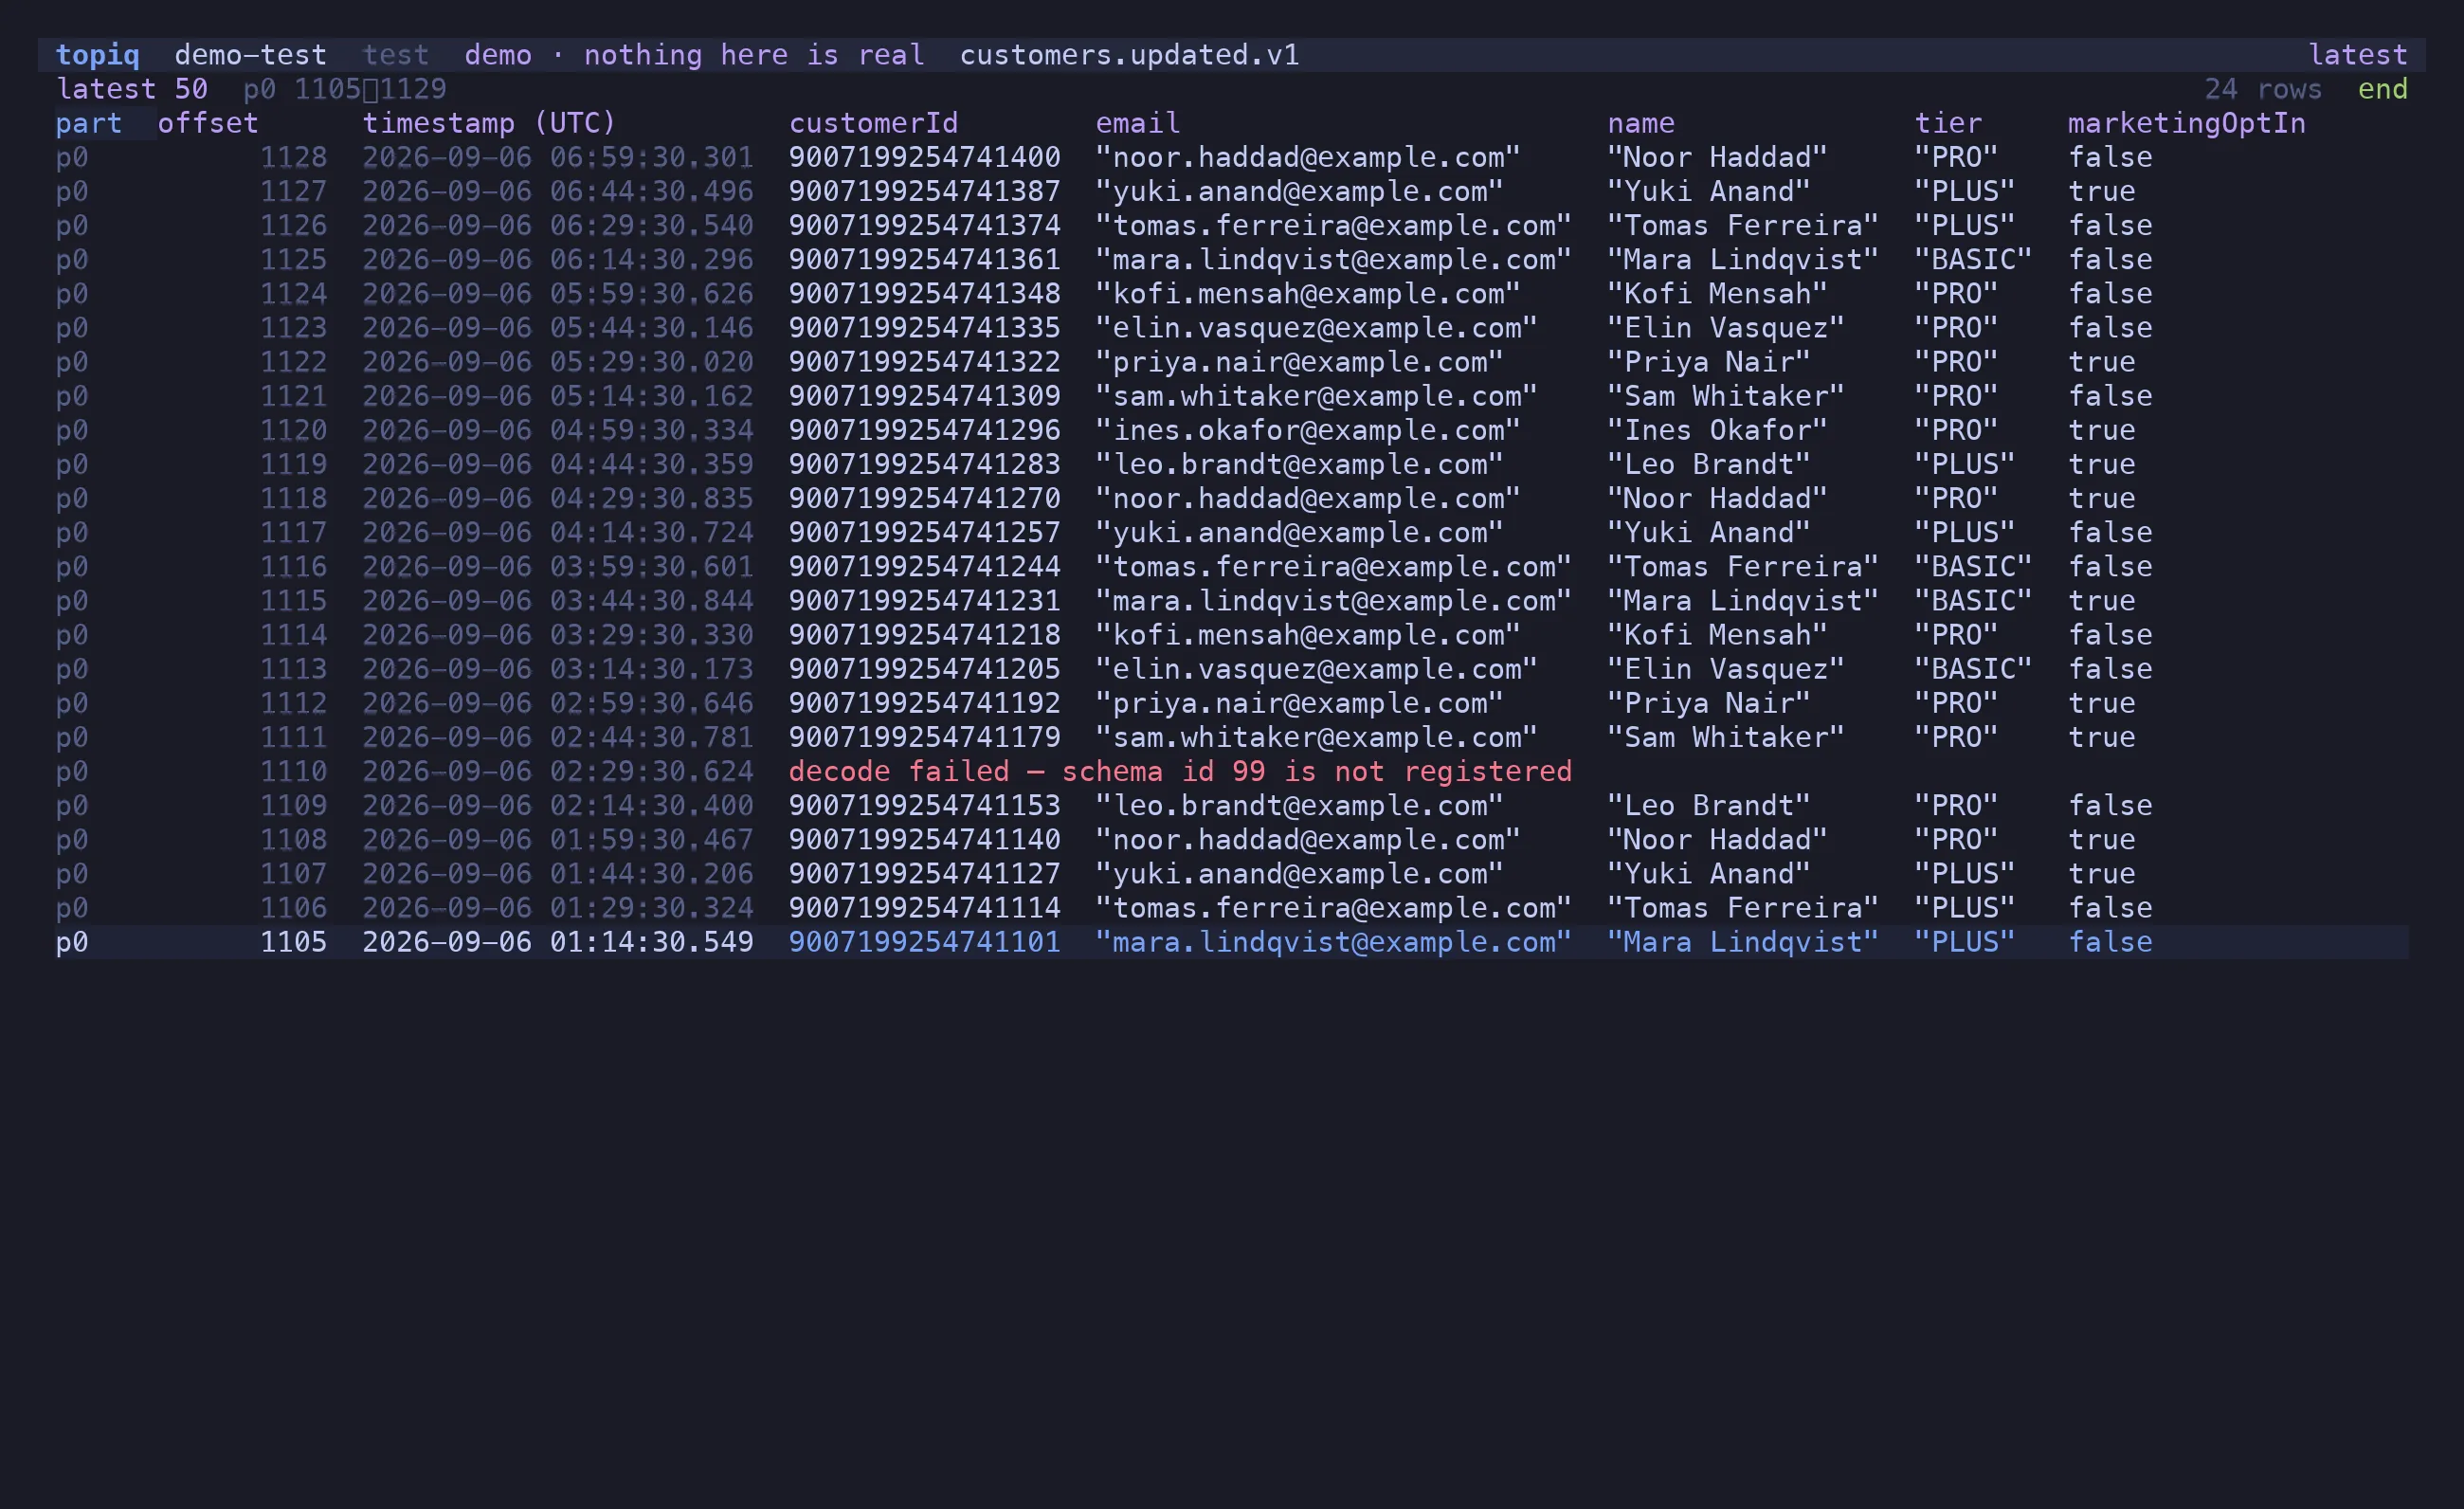
A message that fails to decode — a schema id the registry does not have, a payload that is
not what the schema says — renders as an explicit decode failed row with its raw bytes.
Never a crash, never a silently missing row.
Ranges
Section titled “Ranges”Kafka only reads forward, so “the latest N” is watermark arithmetic: high minus N over the
partitions, over-fetched per partition and trimmed. All of it in BigInt.
| Key | Range |
|---|---|
n |
latest N (default 50, cap 10,000) |
o |
from an offset, on every partition |
t |
from a timestamp — ISO 8601 or epoch millis; a partition with nothing at or after it contributes nothing |
b |
from the beginning |
r |
reload the same window |
A window is capped at 10,000 rows and says so in the header when it hits the cap.
Enter — the message in $EDITOR
Section titled “Enter — the message in $EDITOR”There is no detail pane. Enter opens the message in $EDITOR: partition, offset,
timestamp, schema ids and headers as comments, then the key and the value as lossless JSON
(BigInts as bare digits). Read it, search it, close it.
Follow
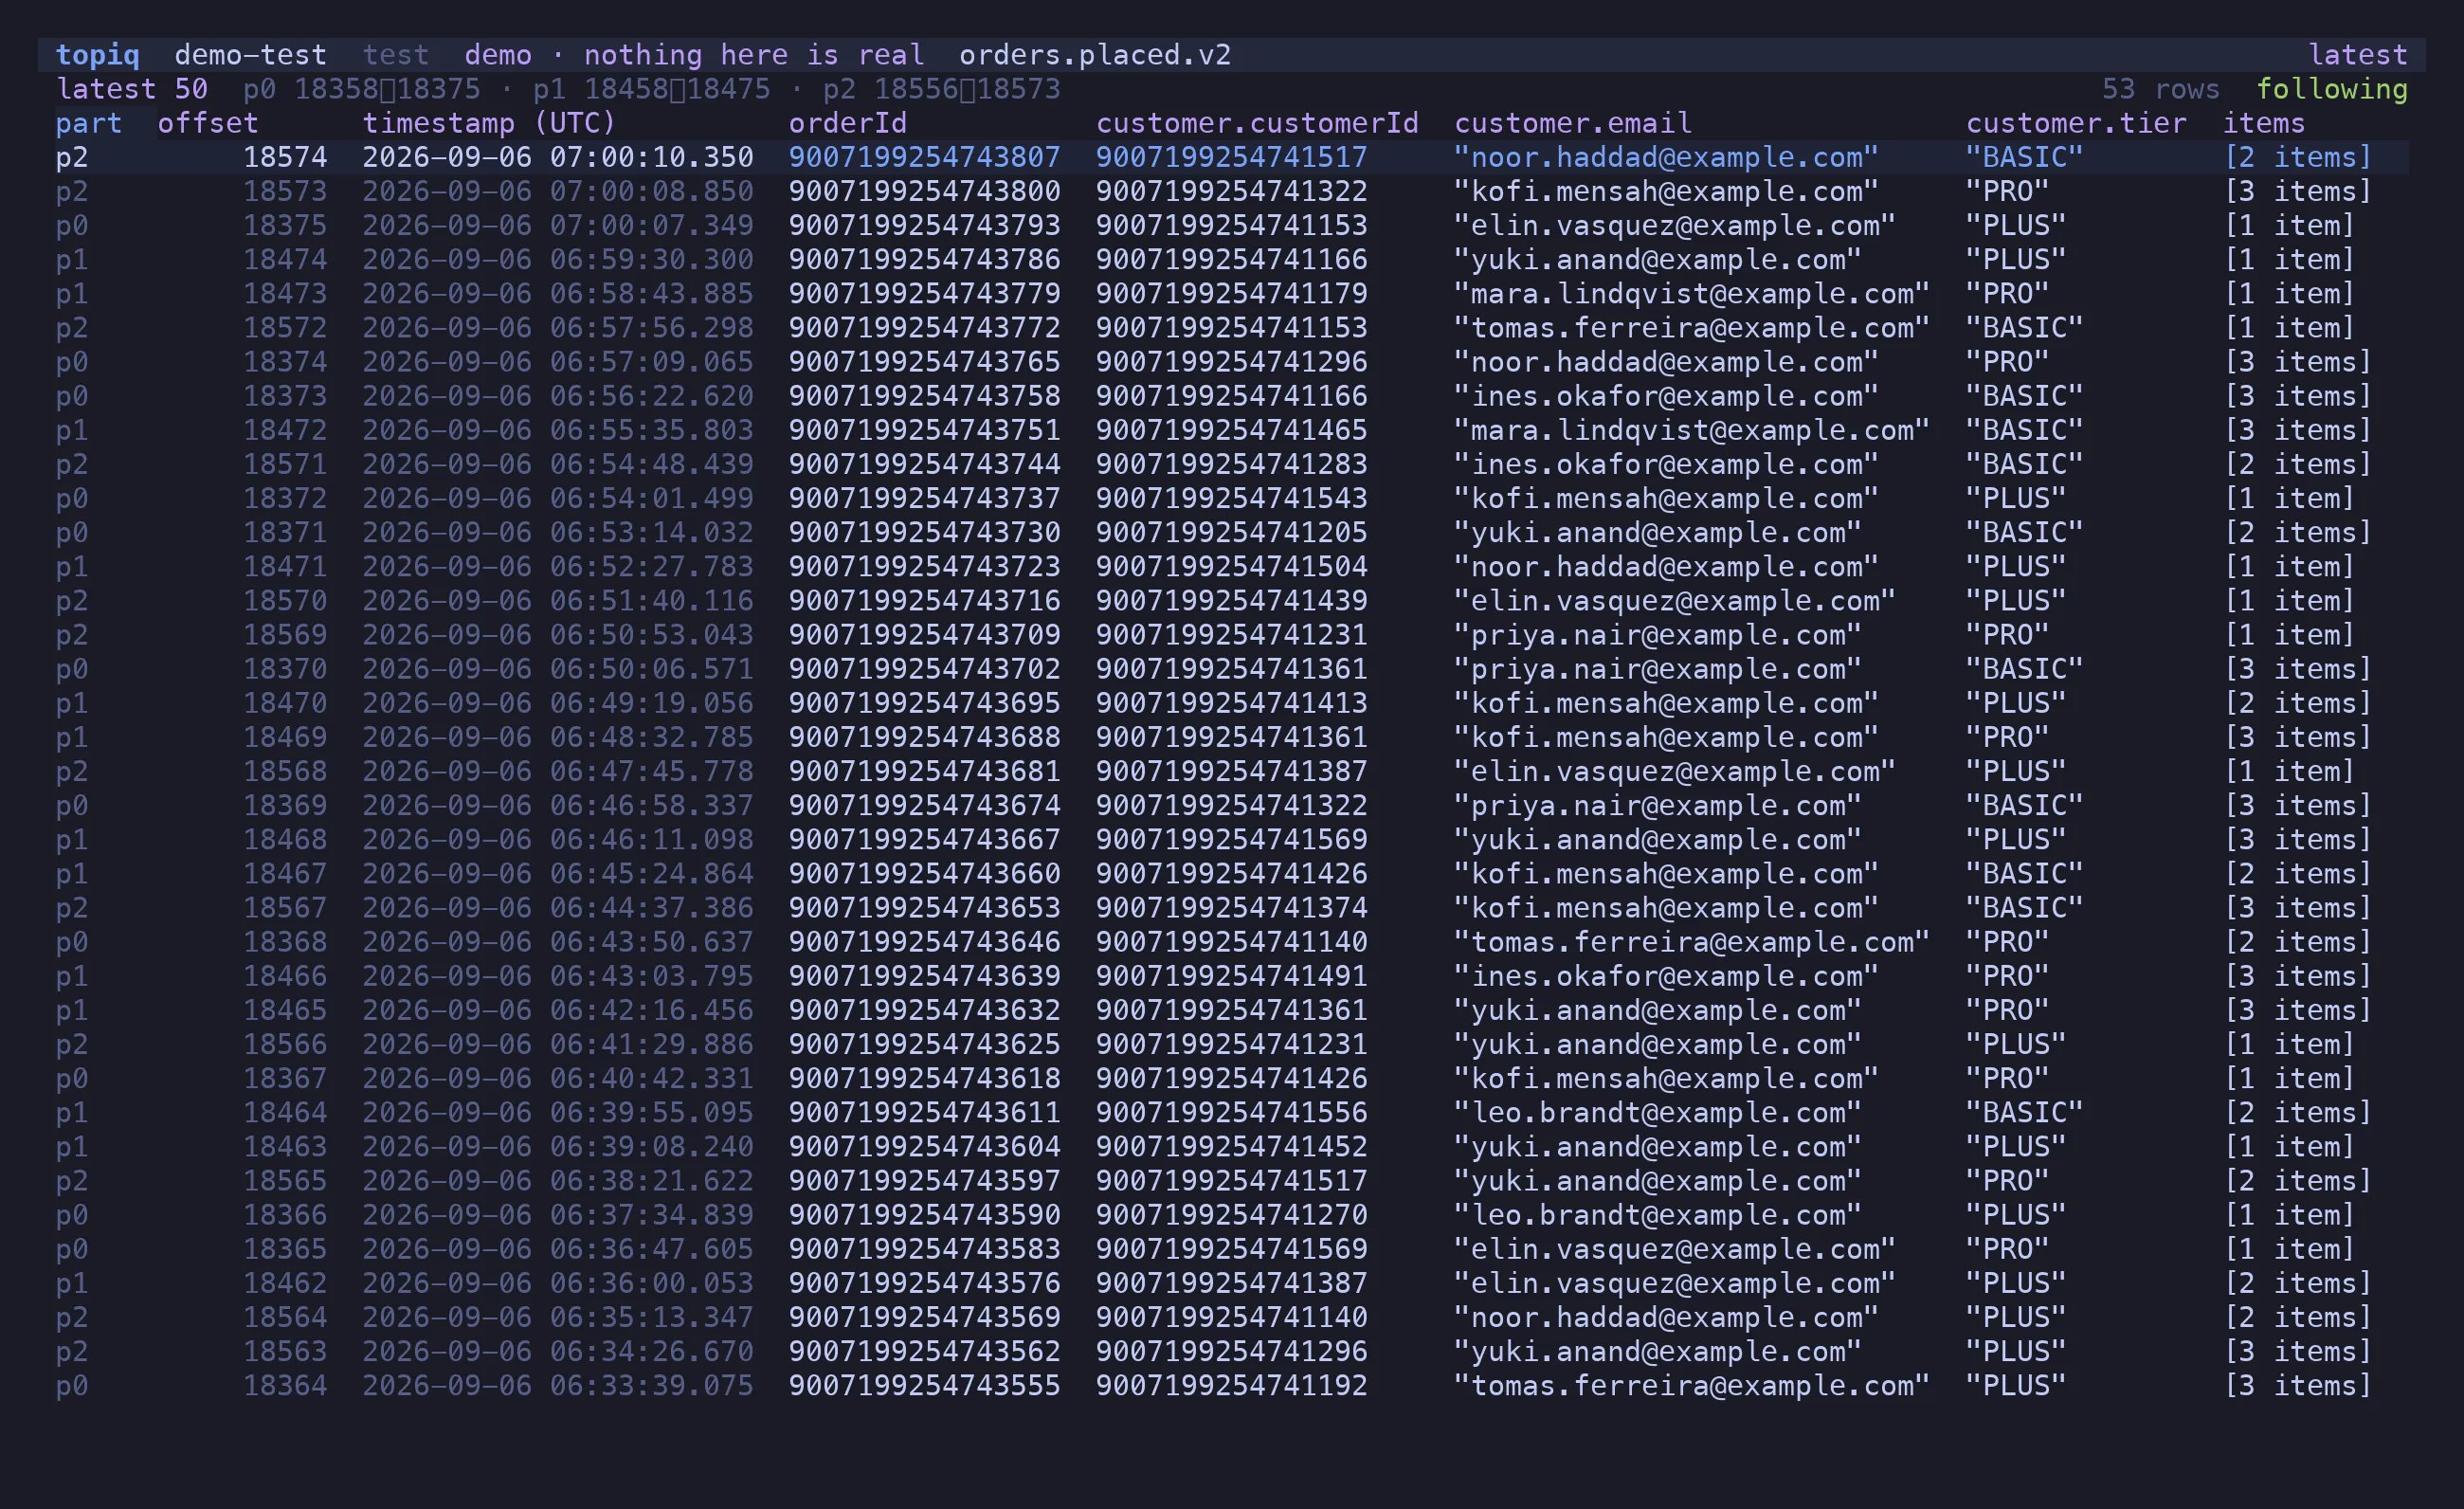
Section titled “Follow”f starts a second consumer where the window ended and keeps reading past the high
watermark. Arrivals land at the top. The buffer is bounded at the same 10,000 rows as a
window; past the cap the oldest row is evicted and counted in the header, as is anything
dropped under backpressure. space pauses without disconnecting — the queue keeps filling
and lands in one batch on resume. g rejoins the live edge after scrolling away.
A filter applies to arrivals before they are buffered, so a narrow filter can follow a busy topic.
The filter bar
Section titled “The filter bar”/ opens it. The grammar is monq’s: terms separated by spaces, implicit AND.
| Term | Matches |
|---|---|
word |
the word anywhere in the rendered value |
field:value |
equality, typed by the field’s decoded type — key:12345 matches a BigInt key |
field>x field<x field>=x |
ordering — BigInt, number, string, ISO date |
field:10..200 |
a range, inclusive |
field:/re/ field:/re/i |
a regex on the rendered form — works on strings, BigInts and subtrees alike |
-term |
negation |
Fields are dotted paths over {key, value, headers, partition, offset, timestamp}:
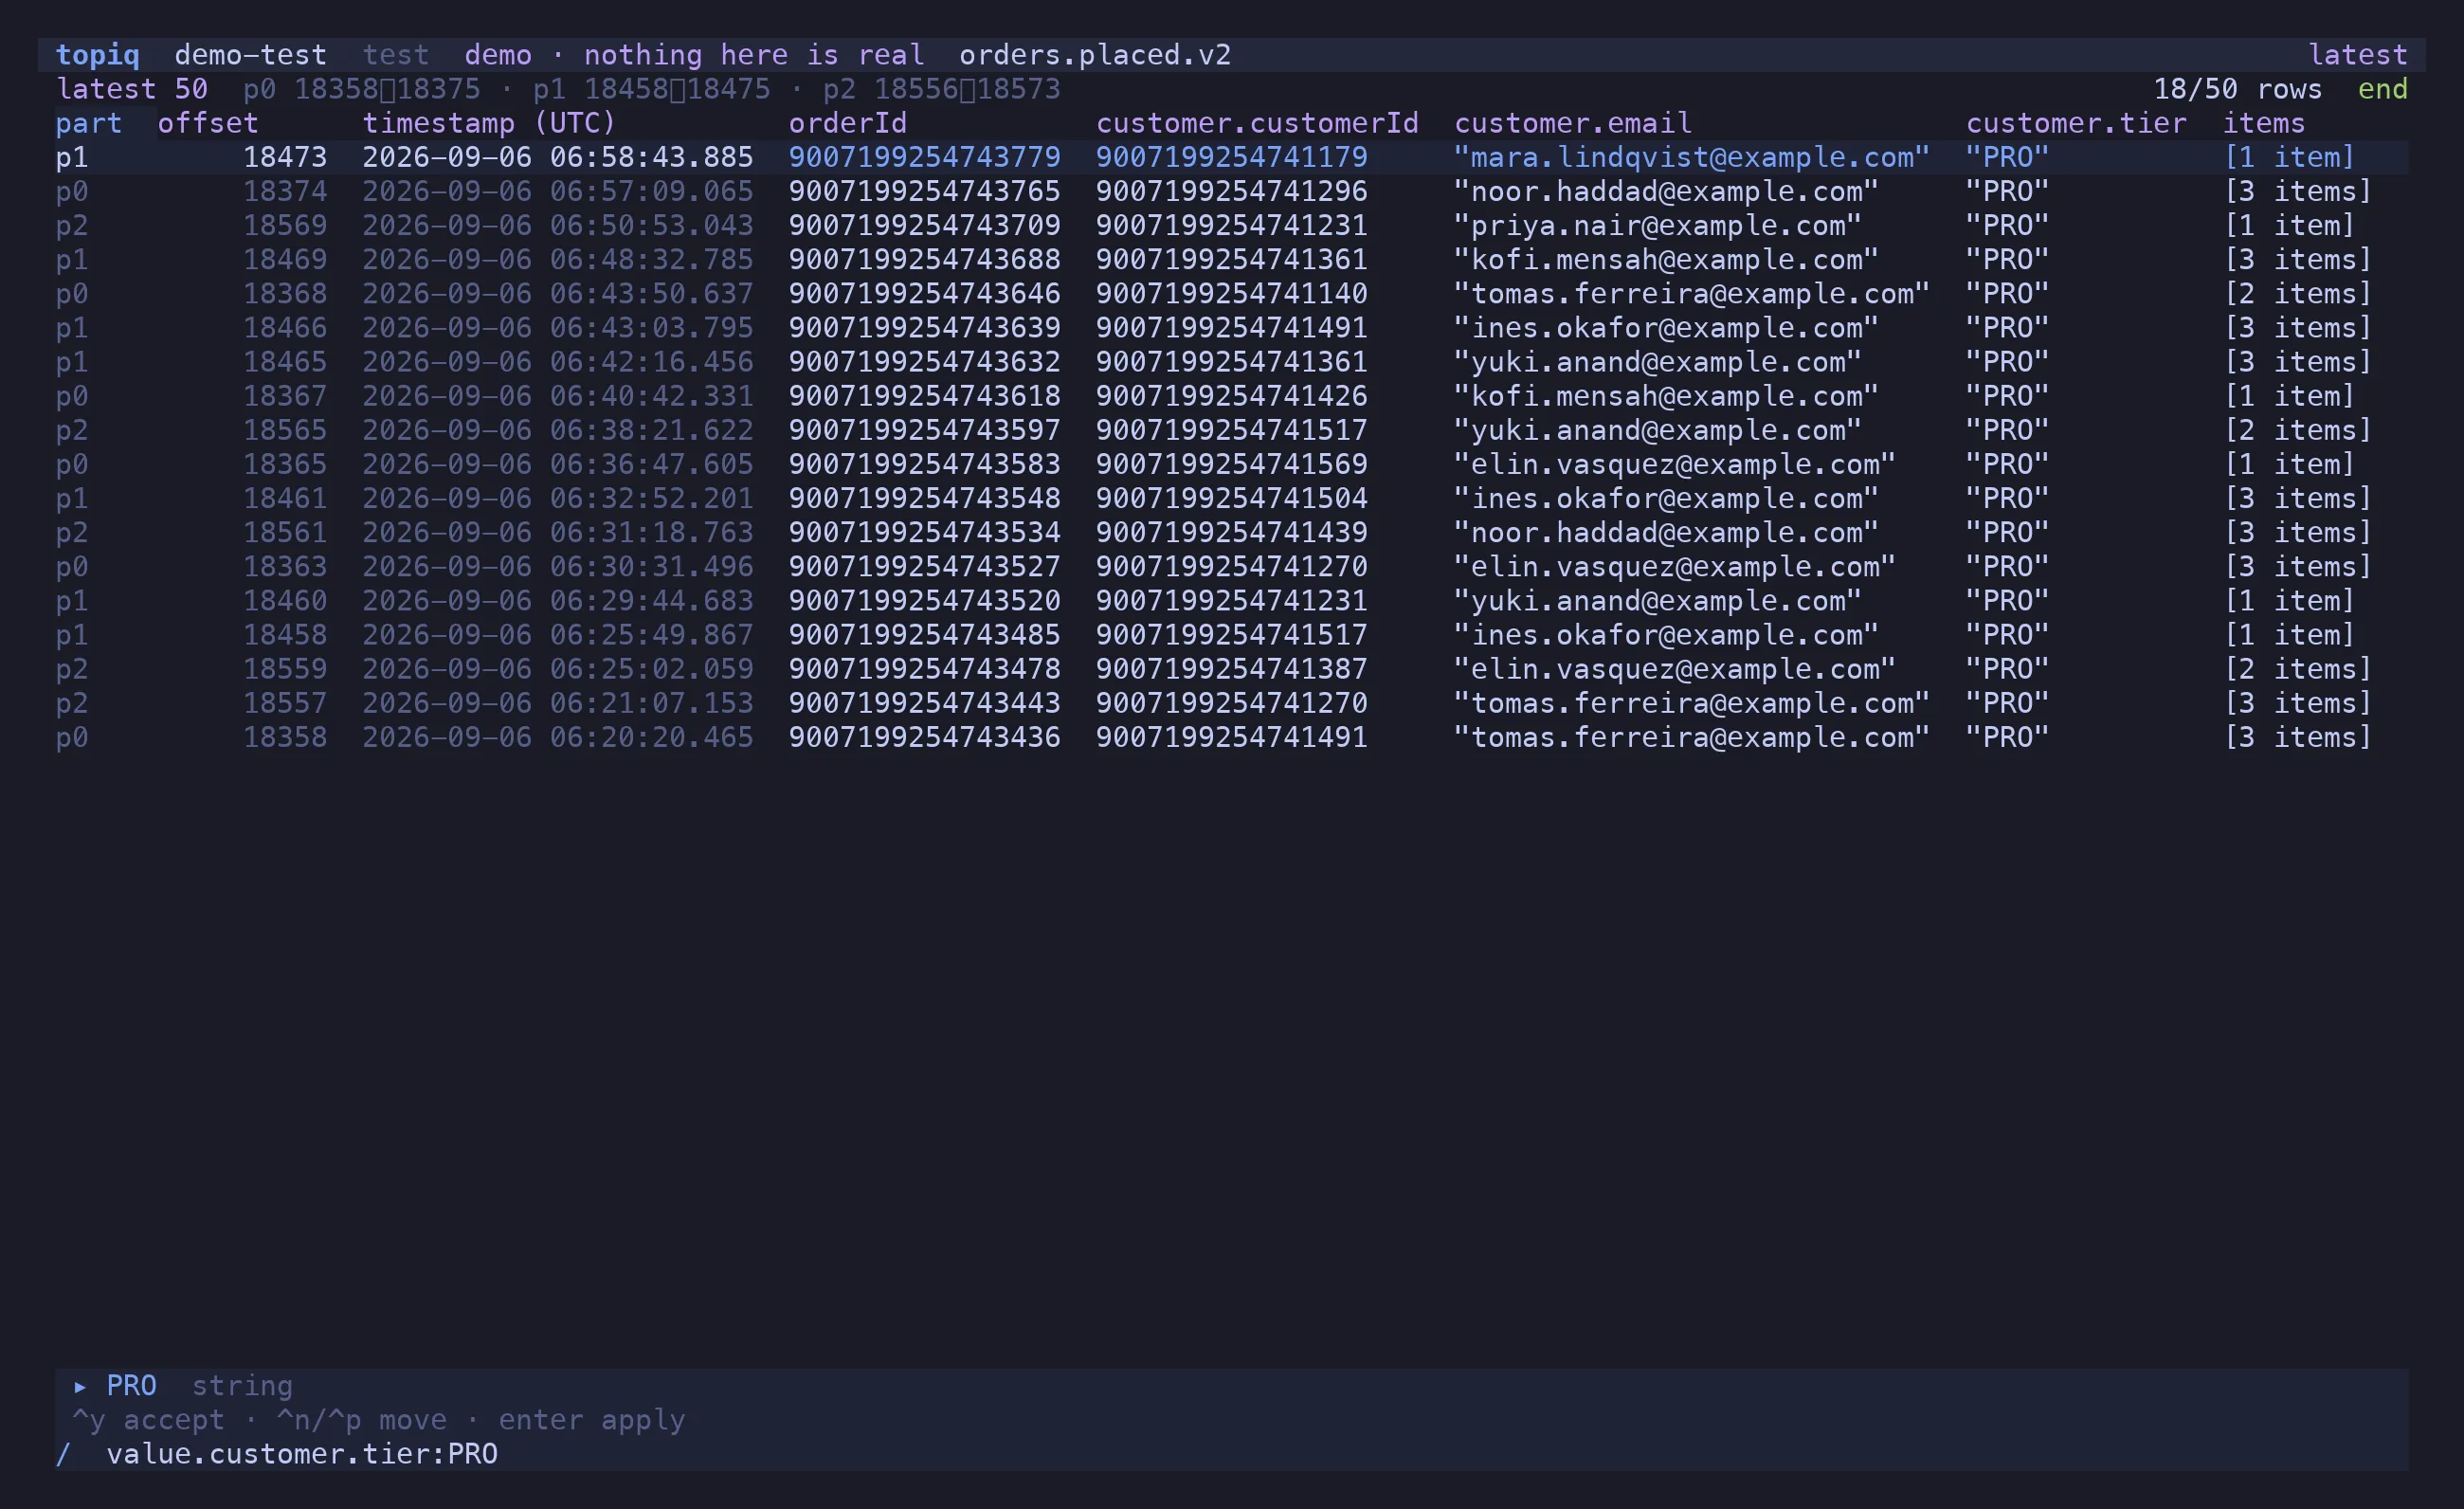
value.customer.tier, key, partition:2, timestamp>2026-09-01.
/ value.customer.tier:PRO value.total>200/ value.customer.email:/@example\.com$/ -value.channel:STORE/ partition:1 offset>18470The filter applies as you type, to the loaded window, and the header shows matched/total.
A malformed expression is an inline error under the bar; the previous result set stays on
screen.
Suggestions
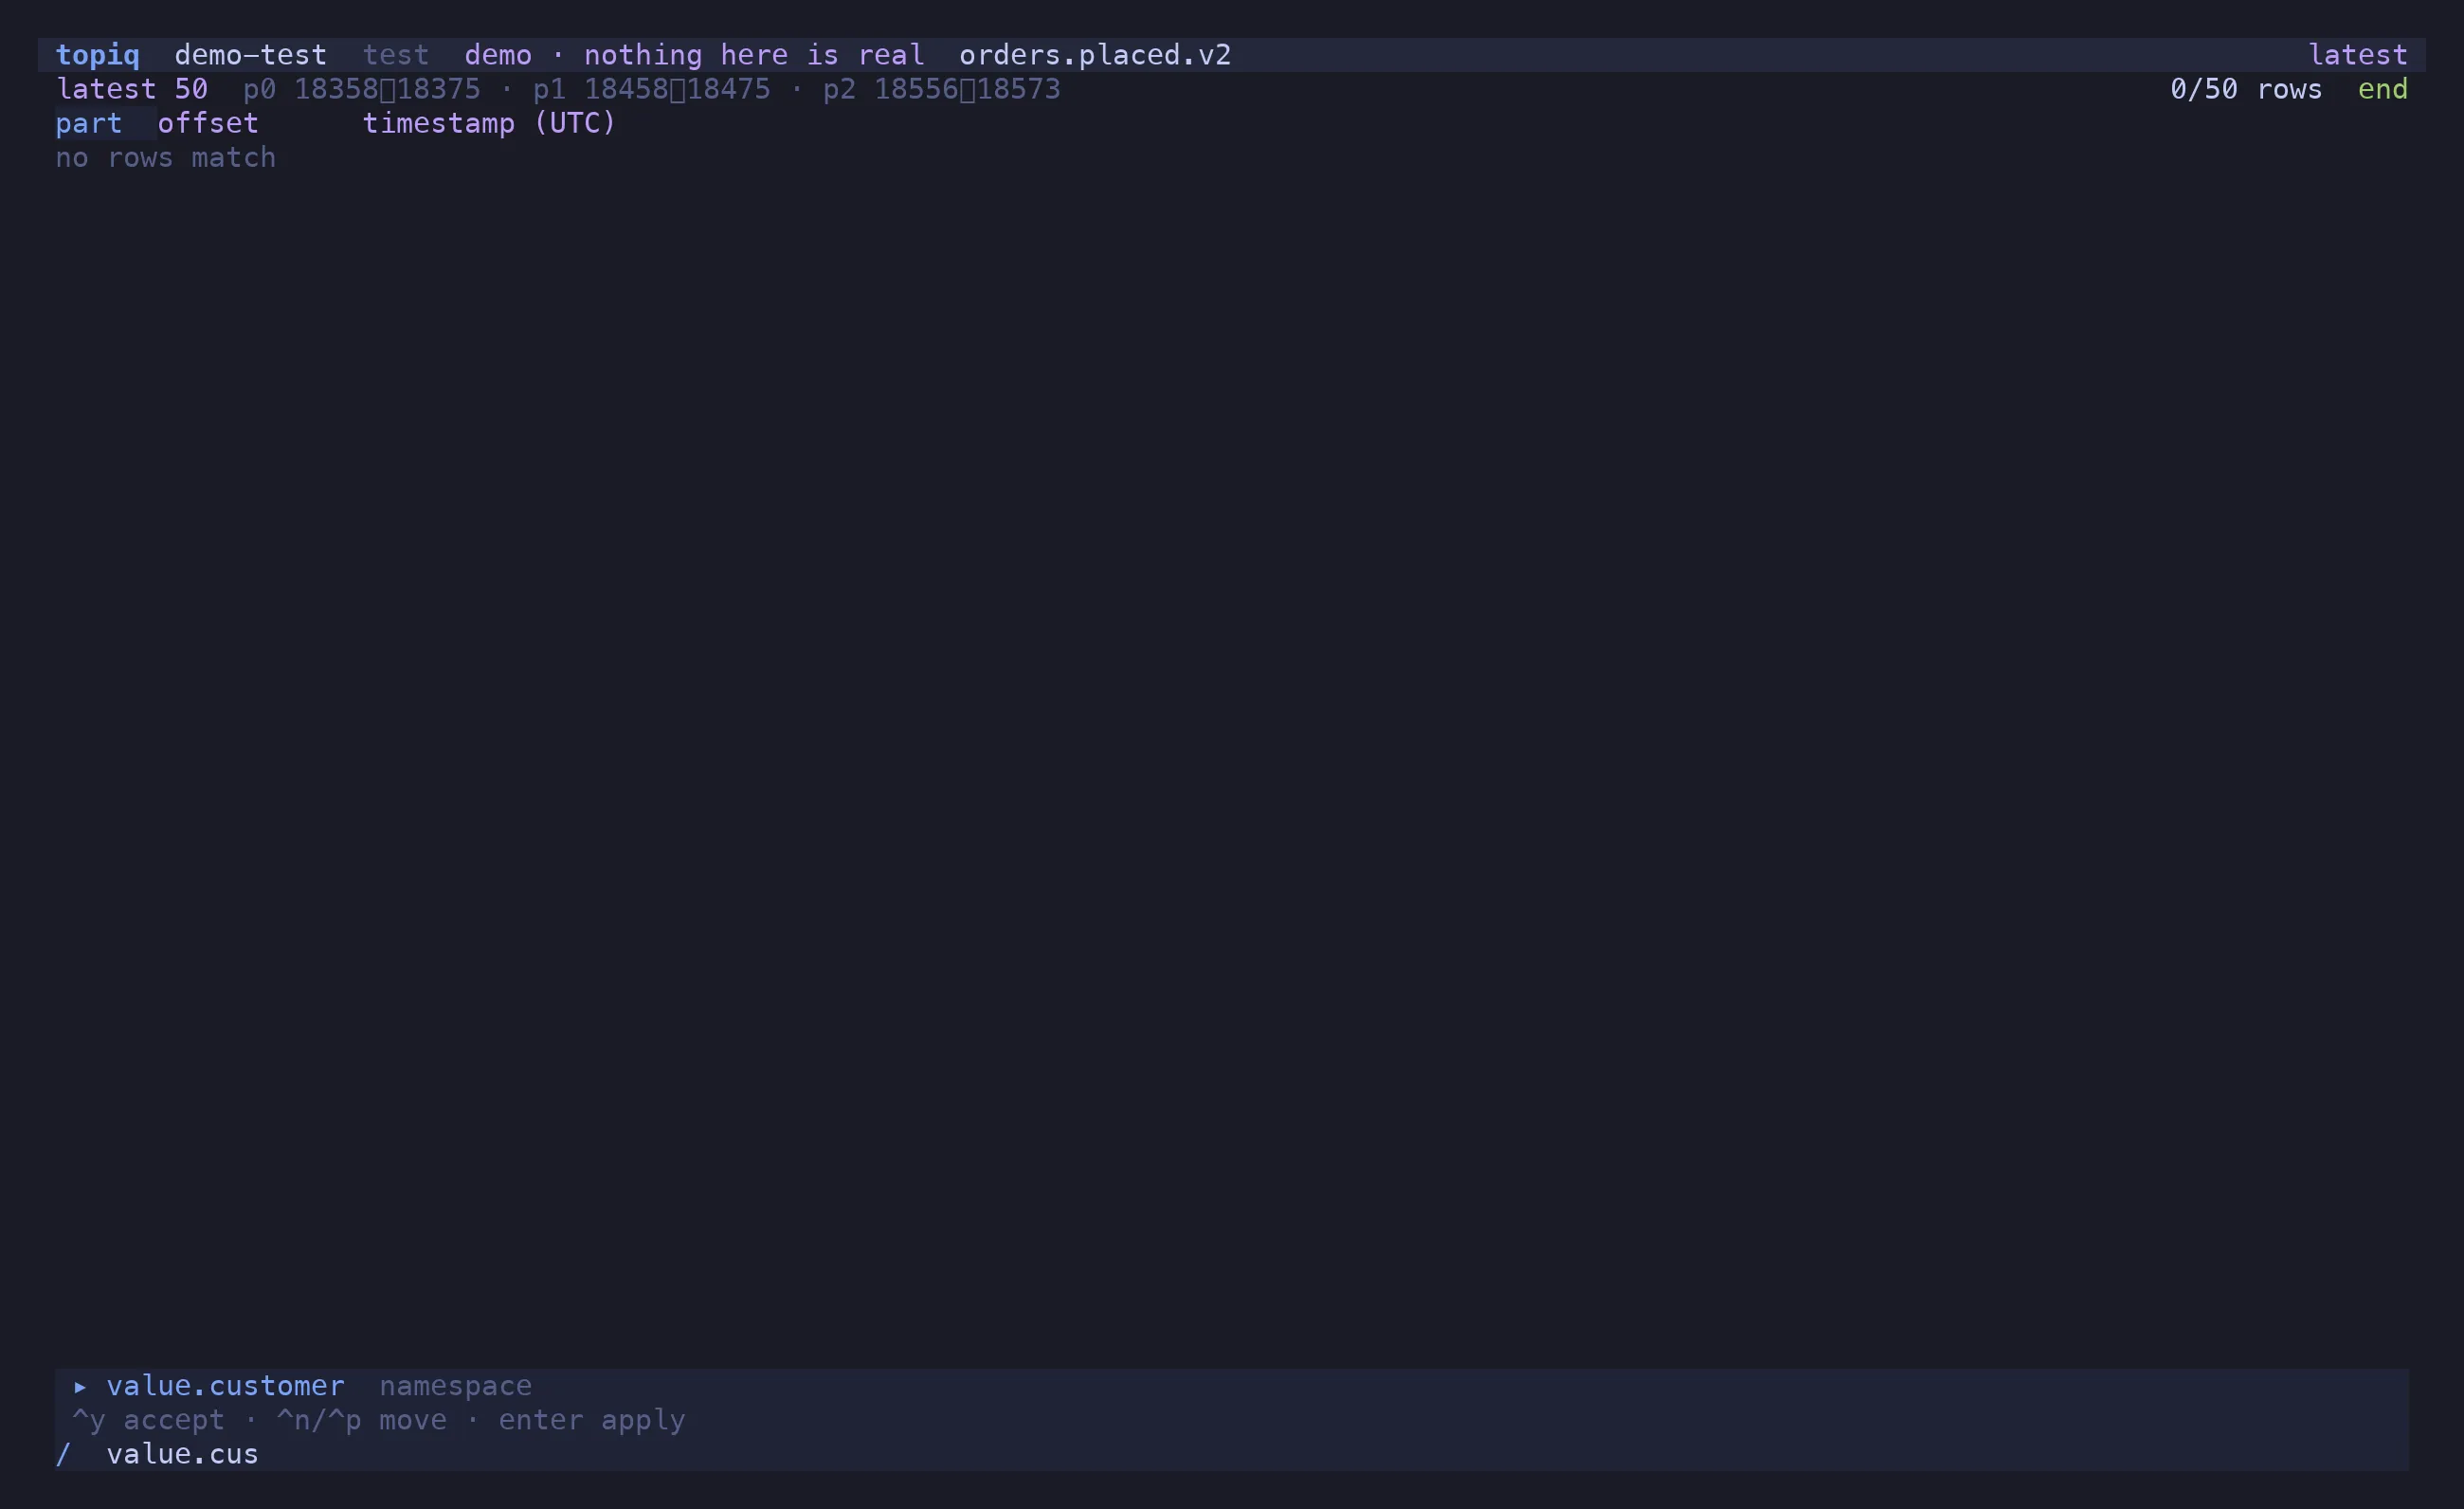
Section titled “Suggestions”Field names complete from what is actually loaded — the envelope roots plus every inferred
column — one dotted segment at a time. val + ^y gives value., which re-offers only what
lives under it. Once a term has an operator, distinct values sampled from the window are
offered instead. ^n/^p move through the list while it is open; ^y accepts.
* on any cell adds field:value for that cell to the bar — the fastest way from “this
row” to “all rows like this”.
The JS escape hatch
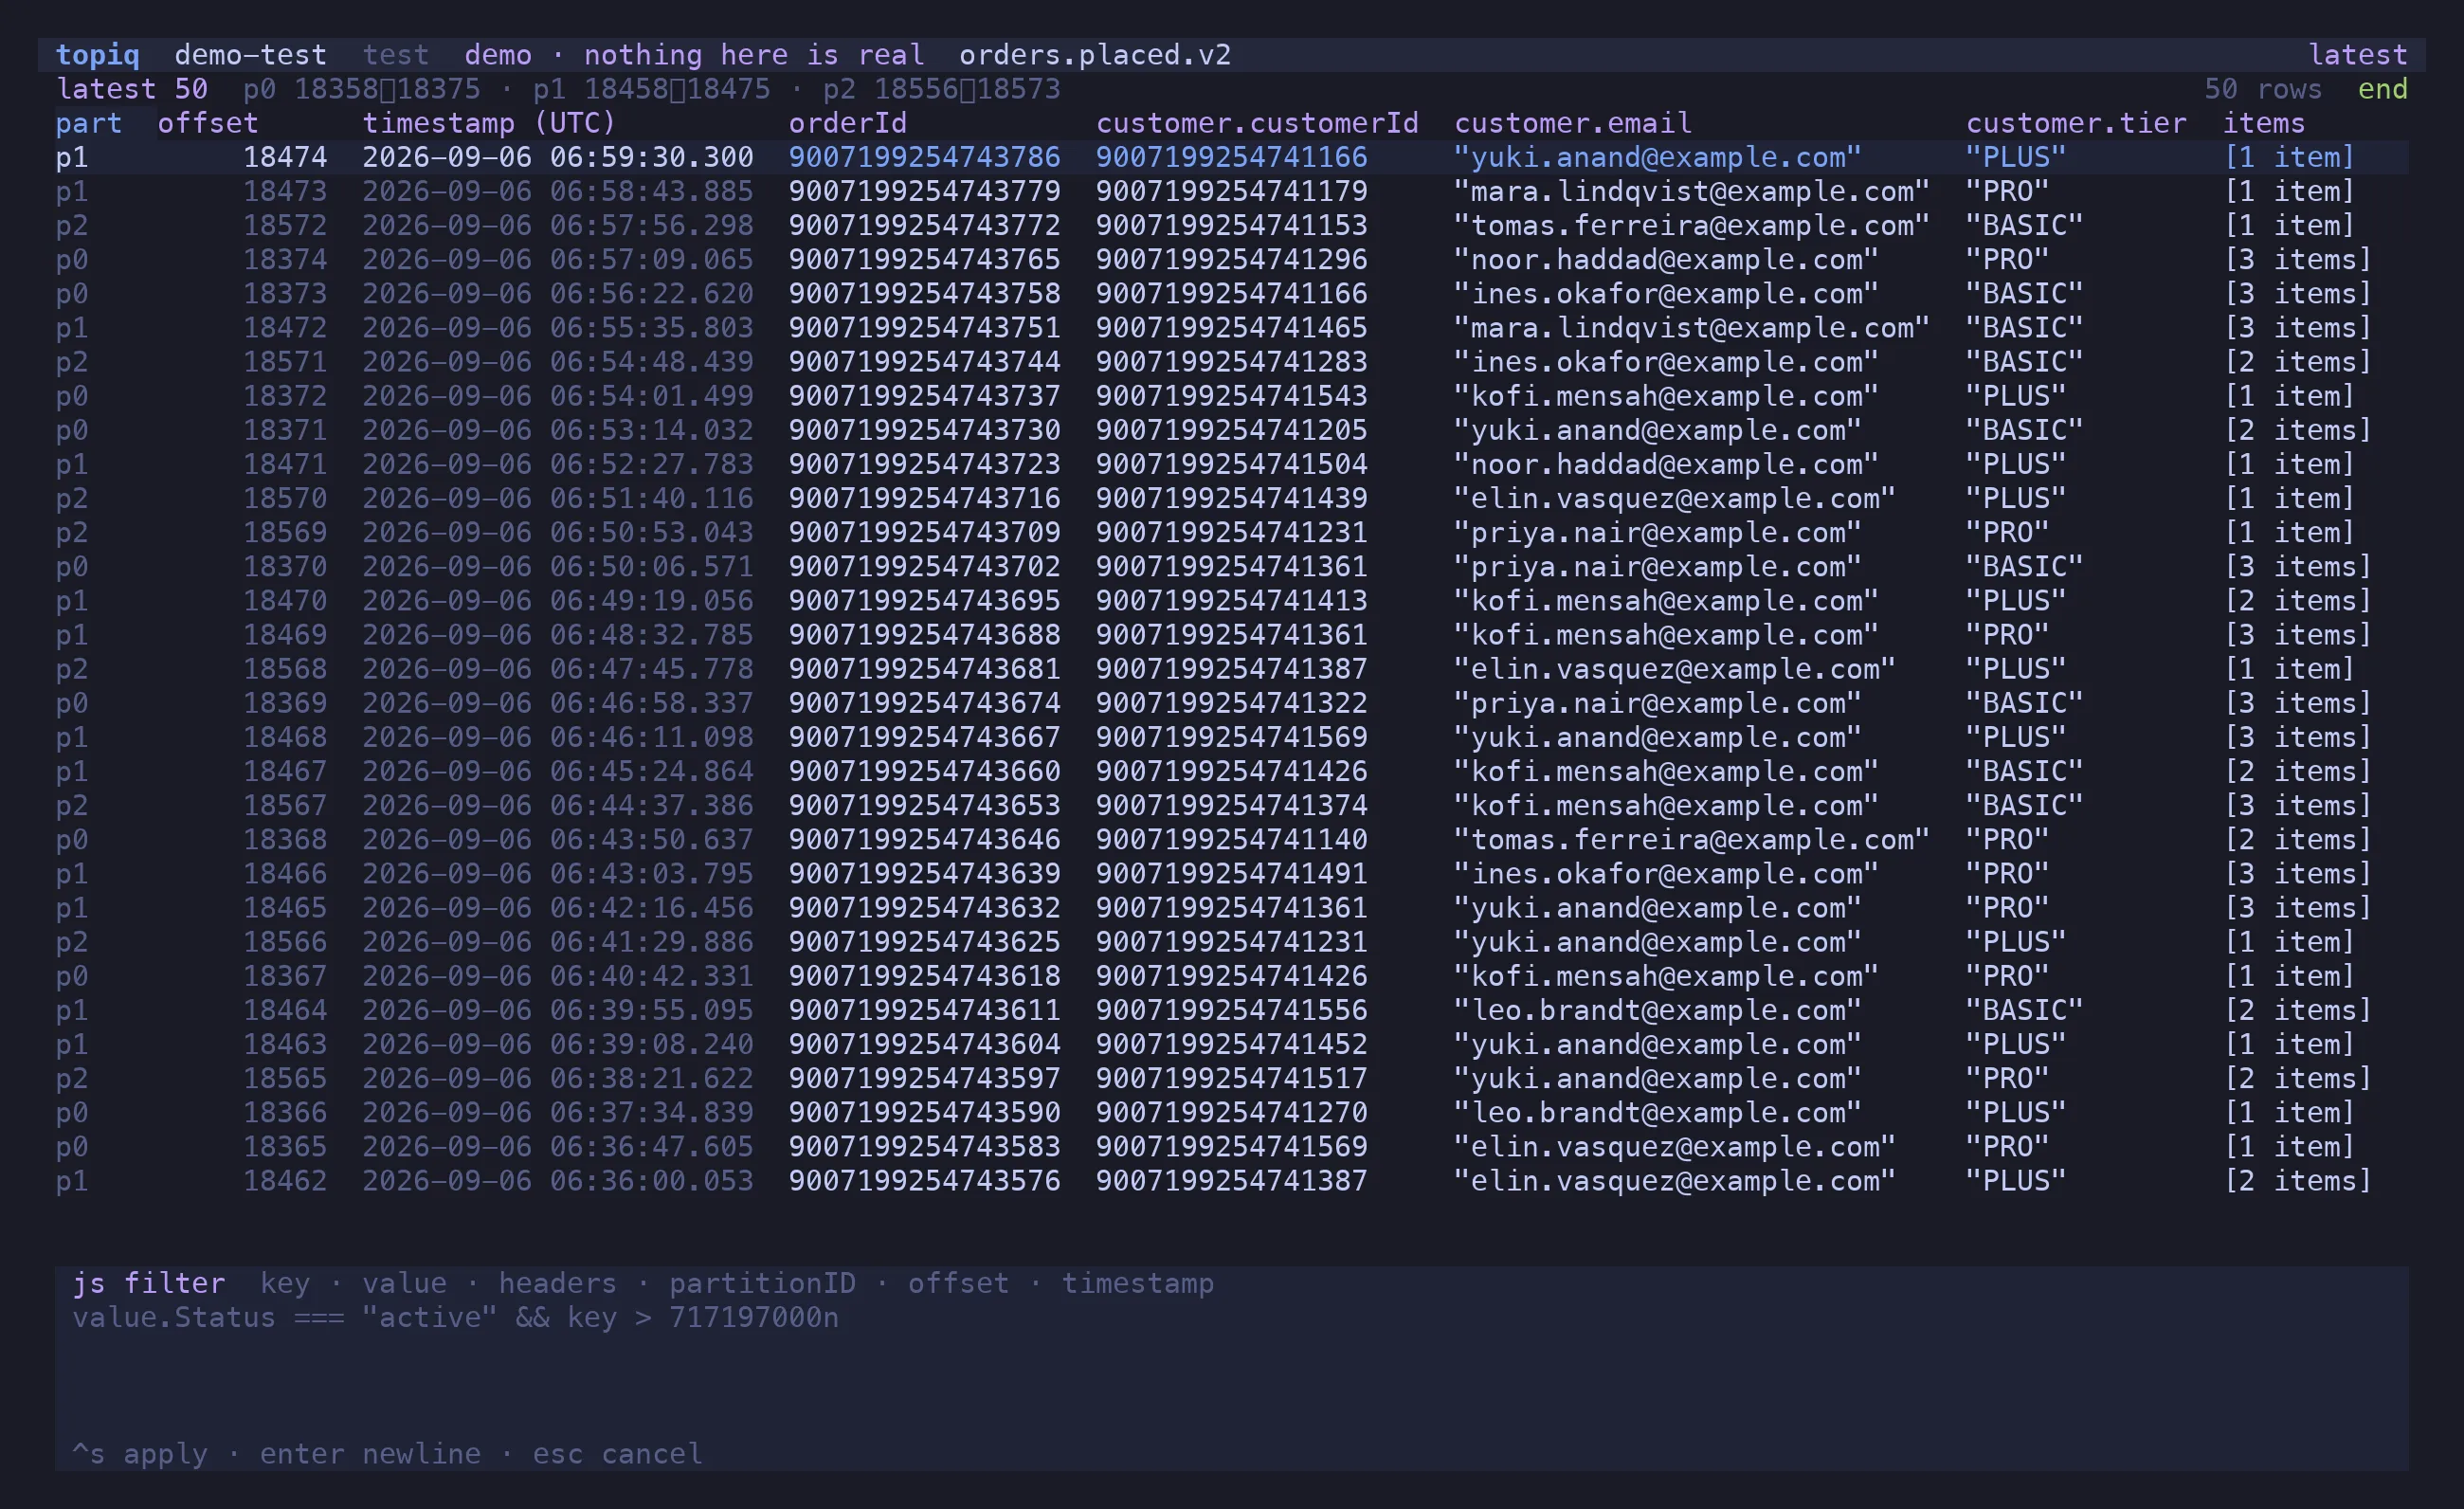
Section titled “The JS escape hatch”= opens a predicate box. Write a function of the decoded message:
(m) => m.value.items.length > 2 && m.value.customer.tier !== "BASIC"m is { key, value, headers, partition, offset, timestamp } with the decoded forms, BigInts
included. ^s applies. It runs locally, in-process, on your own credentials — there is no
sandbox because there is nothing to protect you from but yourself. A predicate that throws on
a row skips that row and reports the error once, in the bar; it does not take the table down.
Scan — filter past the window
Section titled “Scan — filter past the window”Both filter tiers narrow the window, and a window is at most 10,000 rows. So “the order with this id, somewhere in the last four million” has no answer in the table: the row you want was never fetched.
⇧S turns the relationship around. Instead of loading a range and filtering it, topiq streams
the range through the filter and keeps only the hits. Memory is bounded by matches rather than
by messages read, so the range can be the whole topic.
/ value.customer.email:/@example\.com$/ narrow the filter first⇧S then scan the range with itA scan needs a filter — either tier, the grammar or a = predicate. Without one it refuses,
because a scan with no filter is a bigger window and the cap would end it at the same 10,000
rows.
What it reads
Section titled “What it reads”The active range, with one exception: latest N scans from the beginning, since a scan of
the latest 50 is the window it would replace. Every other range scans as it stands, so t and
then ⇧S means “everything since that timestamp”.
Range when you press ⇧S |
What the scan reads |
|---|---|
| latest N (the default) | the whole topic, from the beginning |
b from the beginning |
the whole topic |
o from an offset |
that offset to the end, on every partition |
t from a timestamp |
that timestamp to the end |
It is a real read
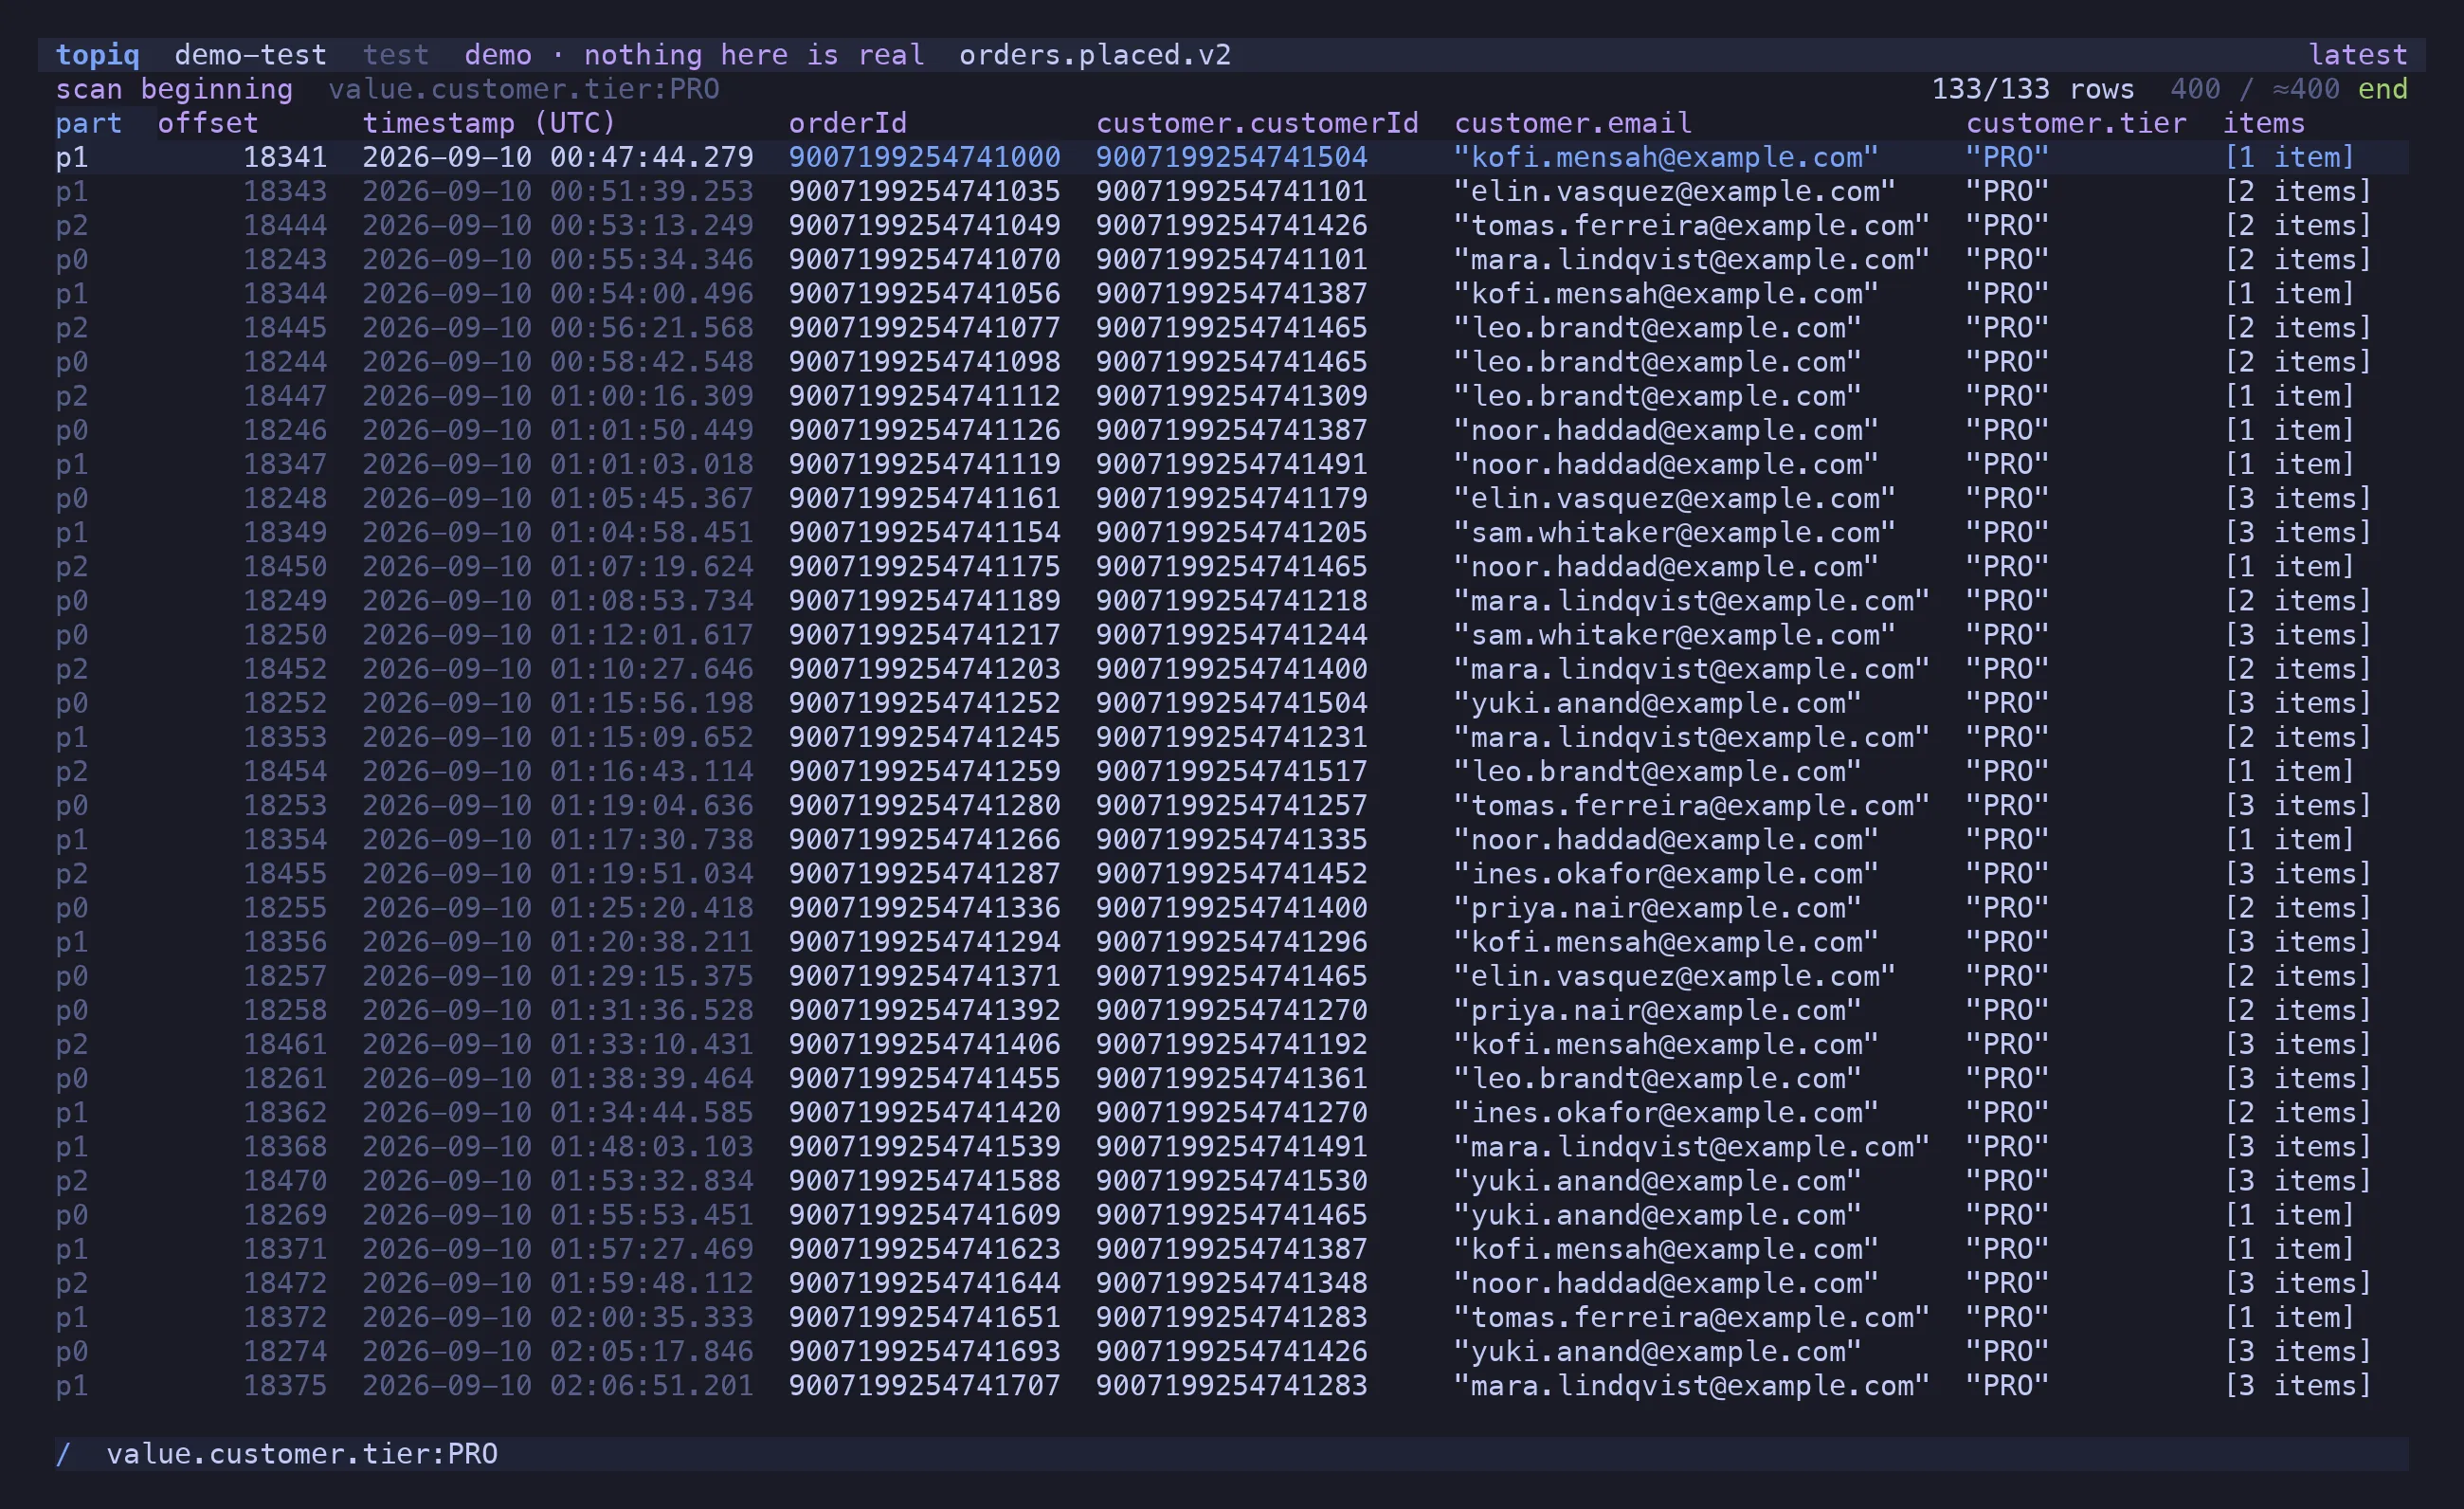
Section titled “It is a real read”There is no server-side search in Kafka, so a scan fetches and decodes every message in the range on your machine. A topic with four million messages costs a four-million-message read — the header is honest about that while it runs:
scan beginning value.customer.tier:PRO 133/133 rows 1,284,000 / ≈4,800,000 18,400 msg/sThe denominator is a watermark snapshot taken when the scan started, hence ≈: a topic being
produced to scans slightly past it. The throughput figure separates a slow schema registry
from a stalled consumer.
Nothing is dropped. A live tail drops the oldest rows at its cap and says so, because a tail is about now. A scan cannot: a skipped message is a wrong answer to a search. When decoding falls behind the fetch, the fetch waits instead — the consumer stops asking for batches until the decode queue drains, and heartbeats while it waits so the broker does not reassign its partitions mid-read.
How it ends
Section titled “How it ends”| State | Meaning |
|---|---|
end |
the range is exhausted — every message in it was tested |
stopped |
you pressed ⇧S again; the hits found so far stay on screen |
capped at 10,000 hits |
the filter matched more than the buffer holds |
scan failed |
the read broke, with the error beside it |
Capped means you hold the first 10,000 hits in scan order, not a sample of all of them — narrow the filter and run it again.
⇧S on a finished scan re-runs it with whatever is in the filter bar now. esc leaves the
hits and returns to the window, keeping the filter.
The filter is fixed once it starts
Section titled “The filter is fixed once it starts”The scan compiles the query as you press ⇧S and keeps that predicate for its lifetime; the
header shows it beside the range. Editing the bar while a scan runs — or after it — filters
the hits that are already on screen, and cannot bring back a row the scan discarded. To widen
a search, widen the bar and press ⇧S again.